Control limits are typically set at +/- 3 standard deviations for the statistic being plotted. That‘s how traditional Shewhart control charts have been constructed for nearly a century. The result is a statistical tool that is simple and elegant, yet robust enough to tackle all manner of different situations and distributions of data.
Control limits and their widths are driven by the size of sigma. But they are also defined by how many standard deviations are specified. For example, if control limits are set at mean +/- 3 sigma, they are wider than when set at +/- 2 sigma. In essence, control chart sensitivity is defined by the width of the control limits.
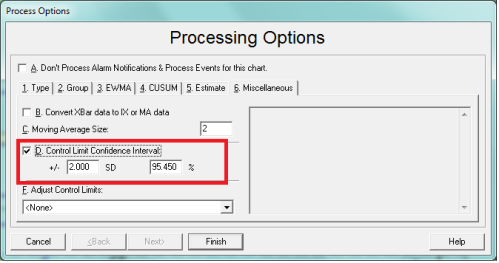
In the upcoming release of ProFicient 4.4, users have the option of modifying control chart sensitivity to suit their particular situation. Just go to the Processing Option window of a control chart, click the Miscellaneous tab, and make changes to option D in the screen clip below:
Option D highlights the new Control Limit Confidence Interval feature. Not only is the +/- SD area able to be modified, but so can the confidence interval itself. As a bonus, when one is changed, the other updates. Therefore, if you want to have control limits set at +/- 2 standard deviations, the resultant confidence interval is 95.45%. Change the confidence interval to 90% and ProFicient communicates that the equivalent control limits will be set at +/- 1.645 standard deviations.
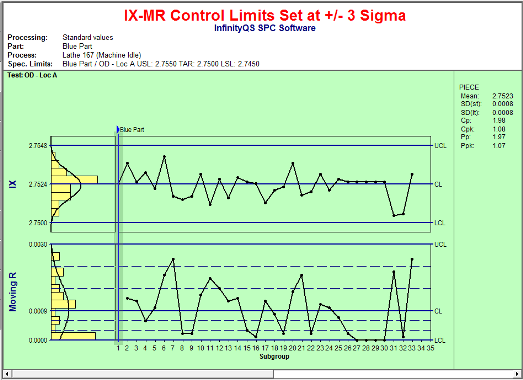
The IX-MR control chart found below has control limits set at +/- 3 standard deviations.
Change the Processing options such that the control limits are +/- 2 standard deviations from the overall mean, and the control limits fall closer to one another, increasing the sensitivity of the chart. The control limits change allowing alerts to be triggered based on the new confidence interval of 95.45%.
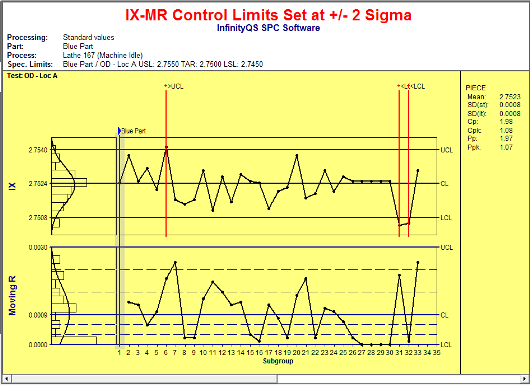
Of course there is no “free lunch.” In the first control chart there were no alarms. In the one above there are three alarms. It’s the same data, yet each chart is interpreted differently. Why?
Think about the +/- 3 sigma standard. Based on the standard normal distribution, control limits should be representative of 99.73% of a process’ “normal” state. Stated another way, it means that when a plot point violates a control limit, there is only a.27% chance (.135% above UCL and .135% below LCL) that it was not a statistically significant event.
In the case of the control chart with +/- 2 sigma limits, there is a 4.55% chance that the alarm is simply a normal event, not a statistically significant one. So which is right? Which is wrong? Well, neither, actually. But they most certainly are different.
What practitioners should instead be asking is, “Which one should I use to control my process?” The answer to this question is one that must be based upon the specific manufacturing situation. In a situation where costs or quality issues can quickly arise based on a small change in the overall mean, then making the control chart more sensitive is a wise choice. Or, consider the case where a quality engineer is uneasy applying an IX-MR control chart with traditional limits. This is a legitimate concern as IX-MR control charts do not have the luxury of plotting averages (and leveraging the benefits of the Central Limit Theorem) which make Xbar and Range charts inherently more sensitive than IX-MR charts. Therefore, there may be more than one good reason for modifying control chart sensitivity.
Regardless, know this: whenever control limits are modified to change sensitivity, there will always be a change in how the chart is interpreted. The bottom line is that these options are available in ProFicient 4.4, and they provide more flexibility, more power and more reason for uniquely creating control charts based on a company’s specific needs.