I’m not a statistician, but I happen to know a few (and I play one on TV). I have heard rumors—from non-statisticians, I must say—that Cpk and Ppk, as useful tools for statistical process control (SPC), are dead. I’m here to tell you that is absolutely false. Cpk and Ppk are alive and well…but (big caveat here) they are over-relied upon in manufacturing.
These powerful performance measurement calculations continue to be very useful in manufacturing today. They are far from dead. But there exists a better way with which to use them to your advantage.
Coming to Terms with Terms
So, the obvious place to begin our discussion of Cpk and Ppk is to focus on why they’re over-used. To be clear, there are four metrics that are commonly used in manufacturing: Cp and Cpk, and Pp and Ppk. Let’s discuss these metrics and the terms that are often associated with them.
In a nutshell, these are all process capability indexes. They are used to define the ability of a process to produce a product that meets your manufacturing requirements. They help simplify the management of statistically controlled processes.
We all know that your specifications define your product requirements. In other words, they define what is expected from an item for it to be usable (and sellable).
Standard deviation is a measurement of the variability of measured values. In the context of SPC, it is typically used to describe product variation caused by the manufacturing process. It indicates how much a product can be expected to vary from the average. The standard deviation is normally fixed for a process that is under statistical control and can only be affected by a process change that affects the variability in a process.
And the mean is the arithmetic average of a group of values.

Into the Weeds!
I hate to go into the weeds, but just to make sure we’re speaking the same language, let’s dive into some definitions…
Cp and Pp are both indicators of what a process is capable of. As with all process capability indexes, the higher the number the better, as this means process variation is very small in comparison to the spread of the specification limits. They don’t convey actual performance, just a comparison of the variation to the specification limits. Cp uses short-term standard deviation and Pp uses long-term standard deviation.
Cpk and Ppk are both indicators of how a process is actually performing. They compare the mean and standard deviation to each specification limit separately to convey a sense of how centered a process is within the specification limits. Just like Cp and Pp, Cpk uses short-term standard deviation and Ppk uses long-term standard deviation.
Finally, making comparisons between the metrics is powerful. If Pp tells us what is possible with a process, the Ppk can never be greater than Pp. The closer Ppk is to Pp, the better centered our process is. The same holds true for Cp and Cpk.
There. Necessary definitions complete. Let’s move on to the thesis of this blog.
Everybody Loves One Number
One of the reasons that many people like these metrics is that most folks don’t use all four. They tend to use Cpk or Ppk. Why? Because these indexes are good for an at-a-glance determination of how your process is performing, and folks like to compare them. We like single numbers in our daily lives. How much does this car cost (and compare that to other cars)? What score did you get on your math test (and compare that to other test scores)? In a nutshell, people like looking at a single number and comparing it with others. It’s convenient, right?
So why should we want to do anything different? Well, the reason we would want to do something different is because, in reality, just looking at one number can be dangerous. One number does not tell you the whole story.

And so, the real power of these indexes is exhibited when you start to compare them. If you just look at your Cpk and you say, “You know what? Anything greater than one, and I’m happy because that means that basically I’m running with everything in spec. Happy days. I shouldn’t expect to have any scrap.” Very generally speaking, that’s what it tells you.
However, Cp tells you how well you could be doing. In the above statement, you could actually be quite far from your ideal state. Further, while Ppk is similar to Cpk, the difference could be significant if you’re delivering a batch of product from many different production lines. Relying on short-term standard deviation makes sense if everything is delivered from that single process, but your customer doesn’t see that variation. They open their bin of product from you and see the variation across ALL of the processes that produced that production run. That’s a better case for using Ppk, but there’s still the trick of rolling it all up across those processes.
None of this is impossible, mind you, but it’s not as easy as that single number we all would prefer.
A False Sense of Security
So, I mentioned at the top that people over-rely on Cpk and Ppk. Mostly, I believe, because many of us have a lot of responsibilities, a lot to keep track of, in manufacturing facilities. Therefore, when you have a lot going on, and no time, you tend to just want to answer that essential question, “How’s my net weight doing overall?” or something similar. The spirit of this is in the right place, wouldn’t you agree? “Give me a Ppk value so I can breathe easier and focus on the next thing.”
However, every statistician I know would tell you that’s not really the right way to do it. We can get a false sense of security from Cpk and Ppk.

Enact Stream Grading is the Answer
Avoiding this false sense of security is exactly why we came up with Enact®. Stream grading is a streamlined way to make the comparisons described above to simplify your understanding of process performance while also making it more powerful. These two benefits seem like they are at odds with one another, but they aren’t. Let’s explore how this can be.
Grading is a fallout-based metric, just like capability indexes. There is an A-B-C component to a grade that is just like Cp. The A-B-C assumes a centered process and uses short-term standard deviation. This tells us how well a process could run if all sources of variation are minimized and is effectively an indicator of my equipment or technology.
There is also a 1-2-3 component to a grade that is just like Ppk (with a twist). The 1-2-3 uses long-term standard deviation and the process mean to understand actual process performance and compares that performance to the A-B-C component. The 1-2-3 is effectively an indicator of my operations (equipment setup, operator training, etc.).
The biggest benefit to this method? Based on the grade, you know what kind of issues you are encountering and can prioritize your resources to address those issues. Another massive benefit to stream grading? Stream grades are designed to be rolled up, so you can see the performance for a given feature (e.g., Net Weight) across all of the processes and parts where the feature is measured. This is something that capability indexes just weren’t designed to do.
To make things visually simpler, grades are color-coded on a green-yellow-red spectrum for easy interpretation. Here is an example of one way in which grading can be presented:
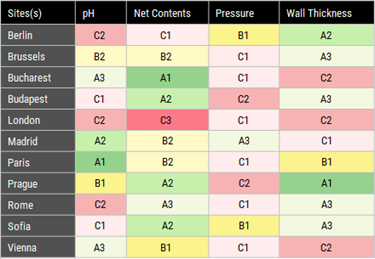
Of all the grades on this report, which site jumps out at you? It’s easy to see that “Net Contents” at the “London” site is having issues with the red “C3” grade. We can also see other grades in this table, as well. Let’s investigate a few key grades:
A1 – The “A” indicates the process is capable of running with almost 100% yield and the “1” indicates the process is running with at least 95% of that capability. This means my equipment is highly capable and my operations are doing a great job running to that capability. Processes with this grade are model processes for others to reference.
A3 – The “A” indicates the process is capable of running with almost 100% yield and the “3” indicates the process is running with less than 90% of that capability. This means my equipment is highly capable and my operations are not leveraging it. This is likely “low hanging fruit” for quick improvements via some training or setup changes.
C1 – The “C” indicates the process is not capable of running with a yield greater than 99.73% and the “1” indicates the process is running with at least 95% of that capability. This means my equipment is having issues and my operations are doing the best they can running the equipment. This is likely an opportunity for equipment maintenance or replacement.
C3 – The “C” indicates the process is not capable of running with a yield greater than 99.73% and the “3” indicates the process is running with less than 90% of that capability. This means my equipment is having issues and my operations are also having issues. This is likely a candidate for a major improvement initiative.
Can you see how these pieces of knowledge make it easy to identify which sites need help and what kind of help they need? As mentioned above, grading is made to be rolled up, which means these grades can be drilled into and more can be discovered. While a site can have an overall grade, there are likely processes within that grade that are running well and others that need to be addressed. This drill-down functionality means it’s easy to find the sites that need assistance and then find out more specifics about where they need that help. For example, drilling into the London site shows this:
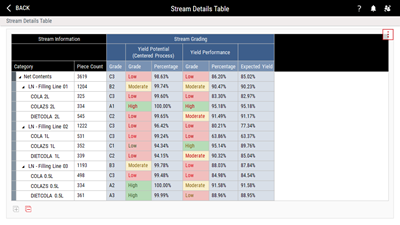
Having an understanding of grading, it’s easy to drill into a site and see where they can use assistance. These kinds of insights are things you just won’t get from a table of Cpk values (or Ppk values, for that matter). Further, trying to gain these insights across all of the processes in a site, let alone across many sites, is almost impossible without stream grading.
Closing
What we offer the manufacturing world with a tool like Enact is a chance to overcome your over-reliance on effective, but often over-simplified, tools like Cpk and Ppk. Why settle for poring over tables of individual numbers when you can see the result of your quality data summarized into an actionable result that shows you where to dig in and helps you understand the details once you do?
You’re busy, and you want an answer that enables you to breathe easier and move on to the next thing. But do it right. Do it accurately and completely. Do it with Enact stream grading.
Take advantage of the technology at your fingertips today: contact one of our account managers (1.800.772.7978 or via our website) for more information.