Product quality reports are dead; long live the SPC dashboard! Delivering information to the user is key to your manufacturing quality control efforts. I think there are three very important aspects to dashboards that make them invaluable to manufacturers: a visually compelling delivery system, reporting made easy (with the help of a centralized data repository), and role-based alerts and notifications.
InfinityQS’ Quality Intelligence platform, Enact®, is the delivery system that users fall in love with as soon as they get their hands on it. Enact dashboards, as well as other important aspects of the system, make it the cutting edge of manufacturing quality software.
1. Visual Delivery System
So, what do I mean by a “visual delivery system?” Just the way in which your SPC-based quality system displays information, how easy it is to get to what you need, the immediacy/timeliness of the information, and how easily you can convey that information to upper management.
The visual delivery system of Enact is an easy-to-use, easy-to-understand, dashboard-driven interface. And it’s tailored to each individual user’s role and needs.
Get What You Want, What You Need
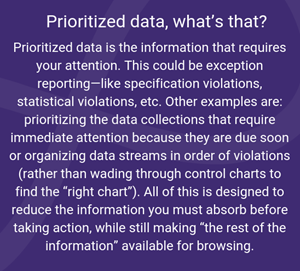
Enact delivers what we call prioritized, or tailored, content. It’s the information that you, the user, need to see. Without all the other extraneous stuff that can distract you. And it’s not just your dashboard, it’s also the notifications that you need to see.
Let’s talk about the dashboard (I’ll talk about notifications in greater detail later in this blog).
Dashboards are Easy to Build
Enact dashboards are super easy to build. Since Enact knows who you are, what your role is, what workstation you’re at, and what you need to see and when, your job becomes easier and you never miss a data collection…or an alert.
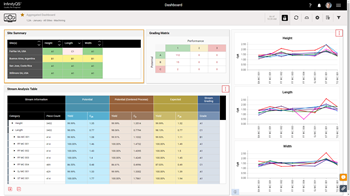
It’s easy to choose what information you want to look it on your dashboard, whether it’s a Pareto chart, or Box-and-Whisker plots, or a stream summary. These items are all data-driven, so all you need to do is setup the parameters of the data you want to see.
Allow me to explain. “Parameter sets” help you determine what you see on your dashboard. A parameter set is a selection of data defined by record count, time span, and one or more descriptor selection (part, process, feature, etc.), and applied to the tiles within your dashboard.
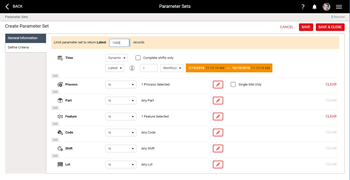
For example, you could create a parameter set of the latest 1000 records from the last month where Process equals Mold #### and Feature equals Wheel Diameter. Though you likely have 10’s or 100’s of thousands of records going back two years for many different molds and features, Enact only returns the subset of data defined in your parameter set. Parameter sets make it easy to customize your dashboard in Enact and provide users with pre-defined data selections that can be applied to any dashboard.
2. Statistical Analysis Methodologies and Reporting Procedures Made Easy
I think we can all agree that reporting is important. Modern SPC has made it possible to improve your data collection, analysis, and overall quality management. But, understandably, you also need to be able to communicate findings to upper management.
For Quality Professionals
Typically, manufacturing quality professionals are creating reports on a periodic basis, which might be weekly, monthly, or even quarterly. To do that, they have to go out and find all the information they need, wherever it may be. Usually, that information is spread out in different systems. Enact brings all the information you could possibly need for your reports into one place.
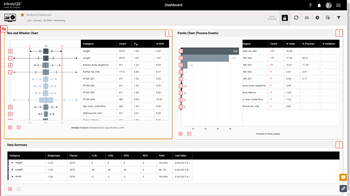
Once your quality professionals get all the information they need together, they must put that information into a format that means something to the audience they’re presenting it to: upper management. As you can imagine, this type of work is time consuming. For even a small organization, this type of activity can take a whole day (or more)—and that’s in the hands of an experienced quality pro!
For Upper Management
Dashboards take a lot of the burden of analysis off the plate of upper management. When the quality pros use a dashboard, like in Enact, the reports that upper management receives are not stacks of spreadsheets they need to pore over to glean any information.
Old fashioned reports are a static snapshot and are out-of-date the moment they’re produced. With the passage of time, they only get more and more out of date. If upper management has any questions or concerns, they must talk to the original author—and that person usually ends up doing more work to arrive at what is asked for. It’s a time-consuming process, to say the least.
The power of the dashboard for upper management is that what they end up looking at is up-to-the-minute information. And when they see something of interest, they can drill down into the details of it with a click. Instant answers, insights, and therefore quick changes. That’s power!
Centralized Data Repository
An important aspect of the dashboard is it gives you complete visibility into your quality data. This is done via centralized data (more on that in the sidebar to the right), and by delivering access to targeted data, filtered by role so that users get just what they need when they need it.
Regardless of the data source, Enact stores all your data in a central, cloud-based repository from which it can be configured, aggregated, analyzed, and compared. Centralized data can be analyzed in aggregate across the company and compared between lines, departments, and sites to optimize insight into manufacturing operations.
Each dashboard consists of customizable tiles that provide data at a glance and allow users to drill down into details. And after a dashboard has been created, users with different roles and access levels can customize it to meet their needs, without affecting the dashboard for other users. That way your organization can reap the benefits of standardized analysis while still giving users the tools they need to improve the quality of processes and products for which they are responsible.
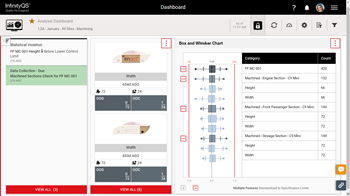
Standardized dashboards are important because they promote consistent practices and standard operating procedures across the company. With everyone using the same tools to look at data from a central repository, users with different roles can make consistent decisions to benefit product and process quality.
Made for the Enterprise – No Matter the Size
So, what does all this about easy reporting and a centralized data repository mean? It means that Enact is perfect not only for smaller companies trying to get a better handle on their processes, but it’s also perfect for larger enterprises, too. You can transform the way you do business by seeing the big picture of how your processes work across the organization.
As our COO here at InfinityQS, Doug Fair, has said many times in blog posts: “To generate big returns on your SPC quality software investment, you need to focus on the big picture. Look at data that represents quality information across multiple production lines, shifts, plants—across the entire enterprise.” And the way to get the big picture view of your organization is with data aggregation.
“Data aggregation is rolling up data across your manufacturing enterprise and uncovering where the greatest opportunities exist for reducing waste, reducing costs, and improving quality. This is how you get a huge return on your SPC investment.”
3. Notifications: Process Control and Monitoring Made Easy
Too much data makes it difficult for users to filter out the noise and focus on the priorities they need to pay attention to. Enact’s highly-visual user experience streamlines delivery of the specific information that each user needs. As my colleague, Eric Weisbrod, InfinityQS’ VP of Product Management, said in a recent blog post, it’s about roles. “Enact knows a user’s role, what data they can see, and even what they are working on at that specific moment to provide only the relevant information.”
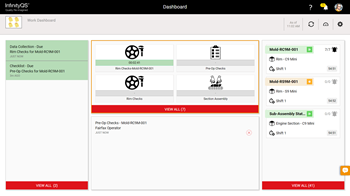
By automating notifications, such as when data collection or compliance checks are due, you are helping your operators—the frontline soldiers in the war against rising costs and manufacturing imperfections. Providing automatic reminders takes the guesswork out of when they need to gather data. It means that they don’t have

to keep checking the clock on the wall or continually glancing at their wristwatch. And it means that there is little possibility of forgetting a data check or violating critical compliance requirements.
Closing
In summary, I’d like to reiterate that dashboards in a Quality Intelligence platform make life easier for everyone. Product quality reports are dead. Dashboards offer a visually compelling delivery system, make reporting easy (with the help of a centralized data repository), and contain role-based alerts and notifications.