Definitive Guide to SPC Control Charts
Discover the most popular quality control charts and how to use them.

SPC DEMO
Don’t miss out! Book a demo of our specialized SPC software and unlock immediate improvements in your processes.
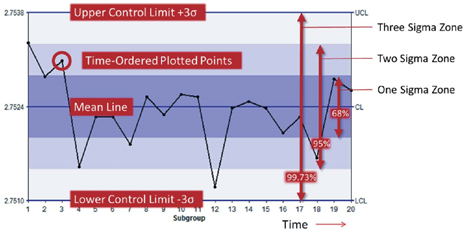
What is an SPC Control Chart?
For manufacturers who use statistical process control (SPC) or are engaged in continuous process improvement activities, SPC control charts are powerful tools for assessing and improving process quality. Control charts provide immediate, real-time indications of significant changes in manufacturing processes that warrant a root-cause analysis or other investigation.
Why Use SPC Control Charts for Quality Control?
The Right Control Chart for Every Situation
Your manufacturing situation is unique, so you need control charts that can manage the variety of products you make while reducing complexities that take up time in your work day.
With InfinityQS® software, you get access to more than a few traditional control charts. From standard control chart options for high-speed production to managing short runs and large numbers of part features, InfinityQS software offers a huge variety of configurable control charting options to help manage your biggest challenges.
Although many different types of SPC charts exist, selecting the most appropriate chart for your situation should not be overwhelming. Let InfinityQS help. Our highly configurable control charts will ensure that you have the best control chart for detecting the right type of variation, resulting in reduced defects and greater process consistency.
In addition, our software solutions automate and simplify chart use to help you get actionable information from your quality data.
SPC Charts Explained
In the pages of this online guide, you’ll find examples of the most popular SPC control charts and analytic displays and learn how they can help you better understand your processes and optimize performance.
For further guidance, download our free resource, A Practical Guide to Selecting the Right Control Chart.
Beyond the SPC Chart: See the Benefits of Modern SPC Software
Today’s manufacturing environments produce an ever-increasing amount of data. With support for automated and semi-automated data collection, using statistical process control through SPC-based Quality Intelligence software makes sense and can help reduce or eliminate the potential for human error.
Think you can’t afford to automate SPC charts?
With InfinityQS, implementing SPC software has never been easier—or more affordable.
SPC Control Charts
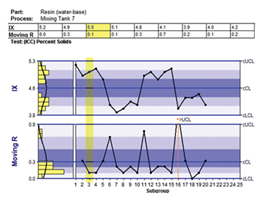
Individual X and Moving Range (IX-MR) Chart
Charts the actual reading and the absolute difference between two consecutive plot points.
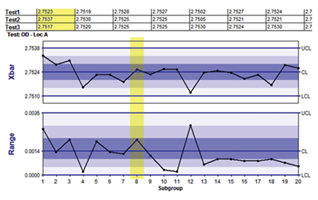
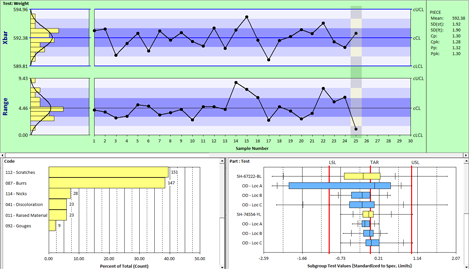
Xbar and Range Chart
Plots the average of individual values in a subgroup.
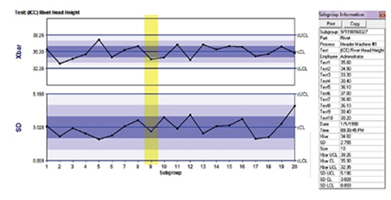
Xbar and s Chart
Plots the average and the sample standard deviation of individual values in a subgroup.
SPC Analytic Charts
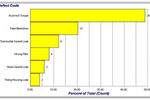 Pareto
Provides a different way to visualize distributions and analyze problem or cause frequency.
Learn More
Pareto
Provides a different way to visualize distributions and analyze problem or cause frequency.
Learn More
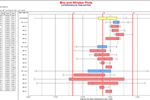 Box-and-Whisker
Shows the shape of a distribution, including central value and variability.
Learn More
Box-and-Whisker
Shows the shape of a distribution, including central value and variability.
Learn More
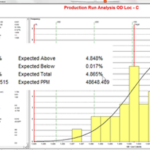
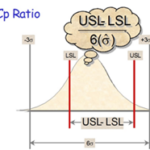 Capability & Performance
Capability (Cp) and performance (Cpk) charts illustrate a process’s ability to meet specifications.
Learn More
Capability & Performance
Capability (Cp) and performance (Cpk) charts illustrate a process’s ability to meet specifications.
Learn More
Speak to a Manufacturing Industry Expert
What to Expect
- Free 20-minute call with a product expert
- Explore which solutions best suit your needs
- No-pressure conversation
- Get a live, personalized demo