Process Capability
Process capability is calculated from existing data but can be used as a prediction of future performance. However, the process capability analysis results must come from an in-control process if they are to be used to predict the process’s behavior in the future. The most commonly used measures of capability are Cp, Cpk, Pp, and Ppk.
Remember, in-control means that the process is showing primarily common cause variation and so is both stable and predictable. Also remember, a process can be within control limits and still be outside product specification limits.
What is Process Capability? Hearing Two Voices
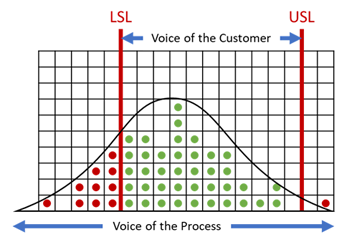
As mentioned earlier, a 6-sigma range (+3 standard deviations) is the voice of the process and show only the expected variability of the process itself. Specification limits are the voice of the customer and represent what the customer expects. The graphic below shows a process that is consistently making product that is out of specification.
SPC Cp Index
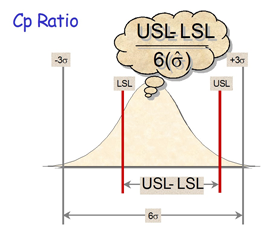
The SPC Cp index shows how well the 6-sigma range fits into the specification range. This measurement is determined by dividing the specification limit (voice of the customer) by the control limit (voice of the process).
Formula for Cp calculation
To calculate Cp, use the following equation:
For example: A Cp value of 1 means that the process variation equals the specification limit range. The process is thus capable (but just barely) of meeting the customer’s criteria.
The Cp index does not consider how well (or how badly) the process is centered relative to the specification limit target. Therefore, the Cp is a measure of optimum capability (i.e., what the process is capable of if it were centered, not what the process might be doing).
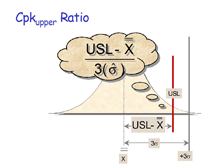
SPC Cpk Index
Like the Cp index, the Cpk calculation shows the relationship of the 6-sigma spread to the specification limits, however, the Cpk considers the centering of the process. There are two Cpk values calculated, one that considers the upper specification limit and another that considers the lower specification limit. The reported Cpk, however, represents the lowest value of the capability against the upper or lower specification. Cpk shows where within the specification limits the process is currently producing, not what the process is capable of producing. To determine whether the process is capable, you must measure Cp.
Cp Versus Cpk
When the process is centered, the Cp and Cpk calculate to be the same number. However, as the process output deviates from the target value, so do the Cp and Cpk ratios. Some observations to consider looking at the graphic below:
- The Cp value remains the same because the width of the distribution is constant.
- Cpk = 0 when the process mean equals one of the specification limits.
- Cpk < 0 when the process mean exceeds one of the specification limits.