Individual X and Moving Range (IX-MR) Chart
Learn how to use this two-chart combination view to keep key characteristics within control limits.

SPC DEMO
Don’t miss out! Book a demo of our specialized SPC software and unlock immediate improvements in your processes.
What is the Individual X and Moving Range Chart?
The IX-MR chart is used to monitor process stability using individual values and moving-ranges as plot points. The Individual X chart (the upper chart in this figure) illustrates an actual individual reading or measurement taken for quality control sampling purposes. The Moving Range chart (the lower chart in the figure) shows the absolute difference between two consecutive individual values.
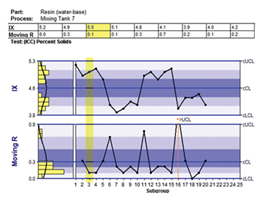
IX-MR Charts for a Single Characteristic
This example chart (taken from InfinityQS® ProFicient™ software) represents several batches of resin—a homogeneous mixture. The chart shows plot points representing the percent solids in each batch. The highlighted plot point shows that for subgroup 16, the moving range plot point exceeds the upper control limit of 0.9.
Scroll down to learn how to use this chart.
Automate and Simplify Control Chart Analysis
See how easy it is to access actionable information from your SPC control charts.
How to Use the IX-MR Chart
Use the Individual X-Moving Range (IX-MR) chart when your sample size is one (n=1).
By using this chart, you can spot variability that falls outside of what would be considered “normal”—indicating a special cause of variation and a need for investigation and possible process adjustment—for a characteristic, such as percent solids in a homogenous mixture. This is a good chart to use when sampling is expensive, time-consuming, or destructive, or when variation from consecutive samples are likely to indicate a measurement error rather than a product variation.
Advantages and Disadvantages of Using the IX-MR Chart
Advantages
- Easy to understand
- Requires only 15 to 25 individual measurements to estimate control limits
- Can plot data after obtaining each measurement
- Requires minimal calculations
Disadvantages
- Does not independently separate variation in average from variation in standard deviation
- Not sensitive enough to quickly identify small changes in process average or standard deviation
- For some special uses, target origins need to be known for optimal analysis
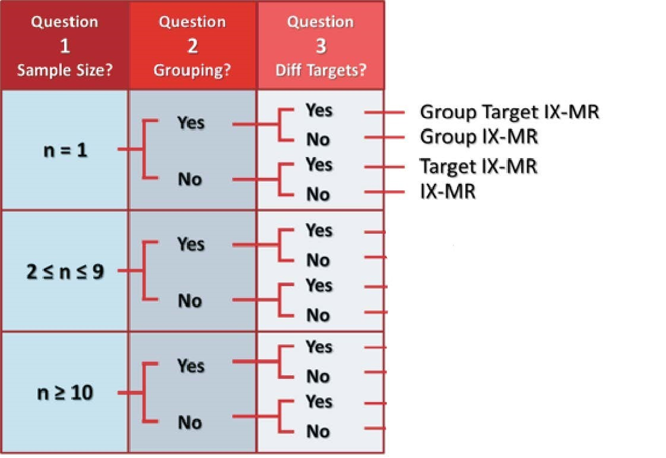
Decision Tree
Use the following decision tree to determine whether the IX-MR chart is the best choice.
Scroll down to see special use examples.
Special Uses
Today, control charts are a key tool for quality control and figure prominently in Lean manufacturing and Six Sigma efforts.
Target IX-MR Chart
Target charts show multiple characteristics that have different nominal or target values—for example, different specification limits or different tolerances—all on one chart.
In these charts, a zero point represents the target value of each characteristic. Like traditional IX-MR charts, target IX-MR charts help you spot variation in a characteristic. By displaying data on the IX chart as deviation from target, target charts help you understand process variation across multiple parts or batches with different specification limit target values.
- Monitor the consistency of a characteristic common to different parts in the same part family.
- Assess tool wear across multiple runs of different part numbers.
Short Run IX-MR Chart
Short run charts accomplish the same goal as target IX-MR charts, but are used for short production runs. These charts combine short run data sets to analyze process capabilities in limited production runs.
- Detect characteristics that need priority attention.
- Gain visibility into the difference between variations caused by the process and those that are limited to one product.
Group IX-MR Chart
Group charts display several parameters, characteristics, or process streams on one chart. With a group IX-MR chart, you can assess relative uniformity or consistency across multiple data streams. In the group IX-MR chart, individual measurements and moving ranges from multiple locations are combined into a group.
- Clearly and distinctly illustrate the extremes or lack of uniformity in a data set group.
- Clearly detect opportunities for improvement.
Group Target IX-MR Chart
As you might expect, the group target IX-MR chart provides the insight of both a group IX-MR chart and a target IX-MR chart. Use this chart to get statistically valid information from multiple part numbers or characteristics that share a common process.
- Get better visibility into the process instead of into individual parts or test characteristics.
- See the difference between variations that are caused by changes in average and those caused by changes in the standard deviation.
Group Short Run IX-MR Chart
When you need to evaluate changes in individual measurements across multiple characteristics in a short run environment, use the group short run IX-MR chart.
- Gain visibility into variations caused by the process as opposed to those that are caused by a specific product, even within short production runs.
Group IX-MR Chart Example
Pinpoint product and process characteristics that are most in need of attention to ensure consistency.
How Do You Use Group IX-MR Charts?
Group individual X and moving range (IX-MR) charts display several parameters, characteristics, or process streams on one chart, enabling you to assess relative uniformity or consistency across multiple data streams. Review the following example—an excerpt from Innovative Control Charting1—to get a sense of how a group IX-MR chart works.
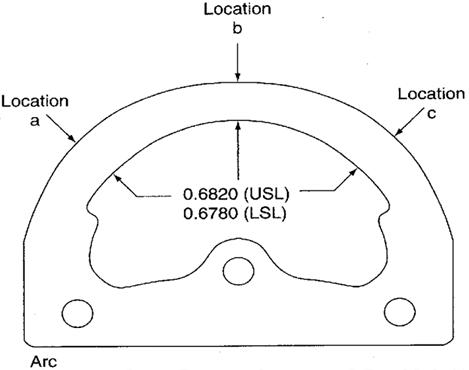
Figure 1. Arc width key characteristic shown with three measurement locations and upper and lower specifications.
Case Description
The arc shown in Figure 1 is a sheet metal stamping. It serves as a guide for a tractor throttle control. For the throttle assembly to function correctly, the arc width must be uniform and within specification. If the width is too large, the assembly binds, if it is too small, the assembly will not lock into position. To monitor arc width uniformity, measurements are taken at three locations, a, b, and c. The quality department wants to use a chart that will examine all three locations simultaneously.
Bring SPC Charts Up to Speed
This example provides a deep dive into the manual calculations behind the group IX-MR chart. InfinityQS® solutions—ProFicient™ and Enact®—automate chart creation and help you optimize processes faster.
Sampling Strategy
Because the same characteristic is being measured at three different locations on the part and there is an interest in evaluating them all on one chart, a group IX-MR chart is used.
Data Collection Sheet
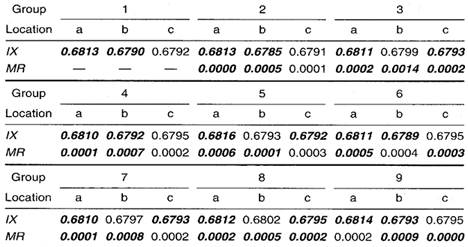
Table 1. Group IX-MR chart data collection sheet. MAX and MIN plot points are shown in bold.
Plot Point Calculations
The Group IX Chart
No calculations are required for the group IX. The MAX and MIN plot points are picked from the individual measurements. For example, in group 1, the largest (MAX) arc width is 0.6813 at location a. The smallest (MIN) width is 0.6790 at location b.
The Group MR Chart
The moving range is calculated by taking the absolute difference between individual measurements at the same location from two consecutive groups. For example, location a in group 2 is 0.6813 and location a in group 3 is 0.6811, so the moving range between the two groups is 0.0002. The moving range at location a between groups 1 and 2 is 0.0000 because the arc width is 0.6813 in both groups for the a location. The same calculations are performed for locations b and c.
Note: There is no moving range for group 1 because no previous measurements exist.
Group IX-MR Chart Plot Points
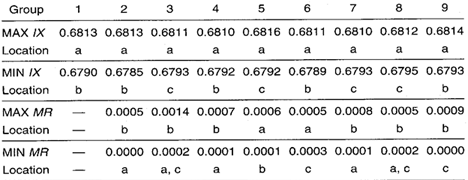
Table 2. Group IX-MR chart plot point summary.
Group IX-MR Chart
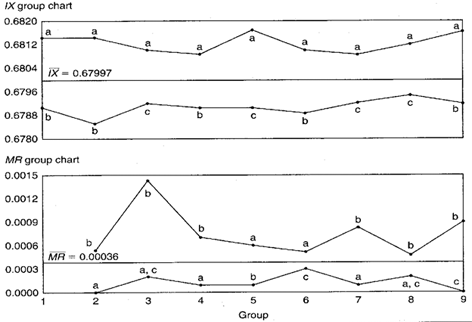
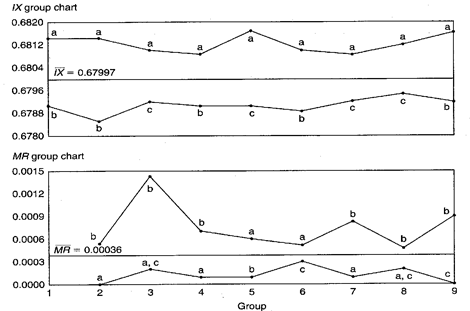
Figure 2. Group IX-MR chart for arc widths.
Chart Interpretation
Group moving range chart: Location b appears in the MAX position six out of eight times. This suggests that location b has the largest standard deviation of all three locations. Location a appears in the MIN position in five of the eight groups. This suggests that the variability at location a may be less than the other two locations.
Group individual X Chart: Location a dominates the MAX position. This means that the arc width at location a is consistently wider than locations b or c. Locations b and c are both found in the MIN position. Even though location c is MIN more often, the raw data show that the individual values for locations b and c are very similar.
The distance between the MAX and MIN lines on the IX chart—0.0023 at plot point 1 and 0.0021 at plot point 9—are indicators of the amount of taper across the arc.
Recommendations
- The consistently larger thickness at location a should be reduced to make the location less prone to binding.
- The variability at location b might be decreased by modifying the tooling to make the arc more rigid at location b when stamping.
This example is typical of what is found in many products that have within-piece variation problems. The group chart helps to detect and highlight those consistently high and low values.
Estimating the Process Average
Process average estimates should be performed separately for each characteristic or location on the group chart.
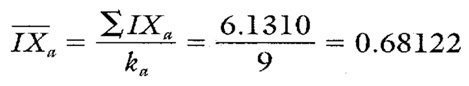
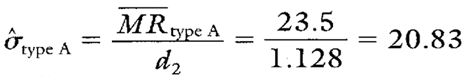
Calculation 1. Estimate of the process average for location a.
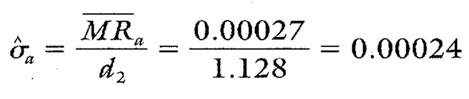
Estimating Sigma
Estimates of sigma are also calculated separately for each characteristic or location on the group chart. Continuing with location a, see Calculation 2.
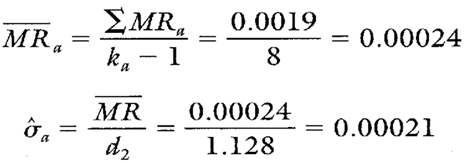
Calculation 2. Estimate of the process standard deviation for location a.
Note: To ensure reliable estimates, k needs to be at least 20. In this example, k is nine. Therefore, the estimates found here are used only for illustration purposes.
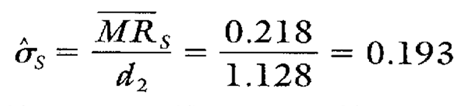
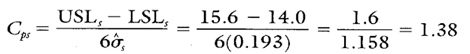
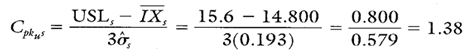
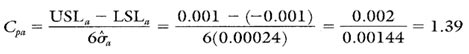
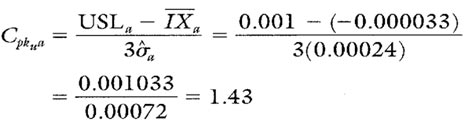
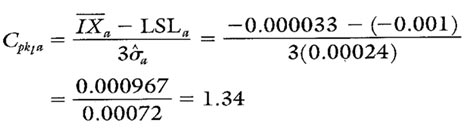
Calculating Process Capability and Performance Ratios
Calculations 3 through 5 show the process capability and performance calculations for location a.
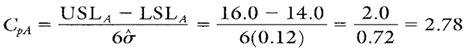
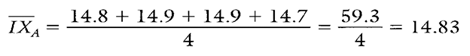
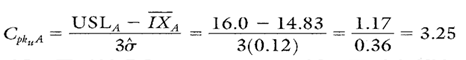
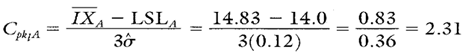
Calculation 3. Cp for location a.
Calculation 4. Cpk upper for location a.
Calculation 5. Cpk lower for location a.
Group IX-MR Chart Advantages
- Graphically illustrates the variation of multiple product or process characteristics simultaneously and relative to each other
- Quickly pinpoints the characteristics that are most in need of attention
Group IX-MR Chart Disadvantages
- Not as sensitive to changes in the process average as the group Xbar-R chart
- No visibility of the characteristics that fall between the MAX and MIN plot points
- Cannot detect certain out-of-control conditions because the group charts shown here have no control limits
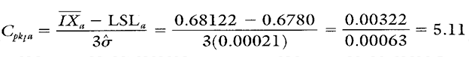
Additional Comments About the Case
Table 3. Process capability and performance calculations for locations b and c.
FOOTNOTE: 1 Wise, Stephen A. and Douglas C. Fair. Innovative Control Charting: Practical SPC Solutions for Today’s Manufacturing Environment. Milwaukee, WI: ASQ Quality Press.
Group Short Run IX-MR Chart Example
Graphically illustrate variation in processes, products, and characteristics on one chart.
How Do You Use Group Short Run IX-MR Charts?
Group short run individual X and moving range (IX-MR) charts can help you evaluate changes in individual measurements across multiple characteristics in a short run environment. Review the following example—an excerpt from Innovative Control Charting1—to get a sense of how a group short run IX-MR chart works.
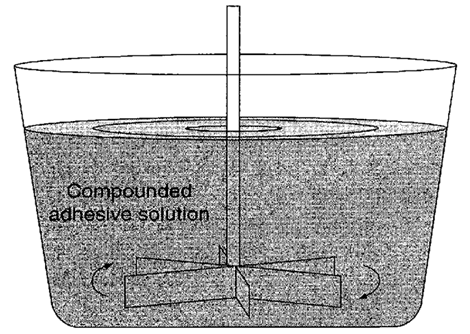
Figure 1. Several parameters are monitored for each batch of compounded adhesive solution.
Case Description
The same mixing equipment is used to mix several different types of adhesive compounds. Each compound has its own unique set of functional test requirements. In this example, three compounds are examined: compound A, B, and C. The test requirements for each are listed in Table 1.
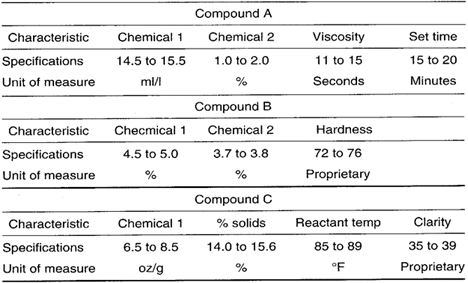
Table 1. Test requirements for compounds A, B, and C.
Bring SPC Charts Up to Speed
This example provides a deep dive into the manual calculations behind the group short run IX-MR chart. InfinityQS® solutions—ProFicient™ and Enact®—automate chart creation and help you optimize processes faster.
Sampling Strategy
The test characteristics, specifications, and units of measure are different for each compound, and only one measurement of each characteristic is gathered from each batch. Therefore, a group short run IX-MR chart is selected for use. Target values are established for each characteristic from each compound. The target IX values are set at the engineering nominal, but the target MR values were derived from quality assurance records.
Target Values
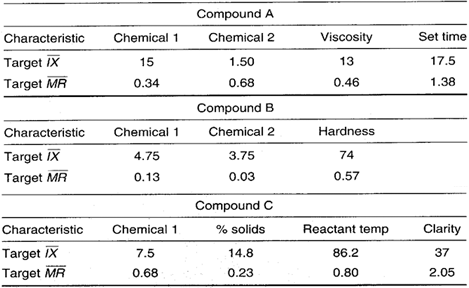
Table 2. Target values for compounds A, B, and C.
Data Collection Sheet
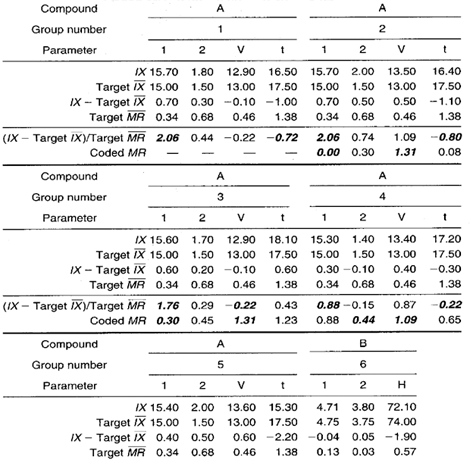
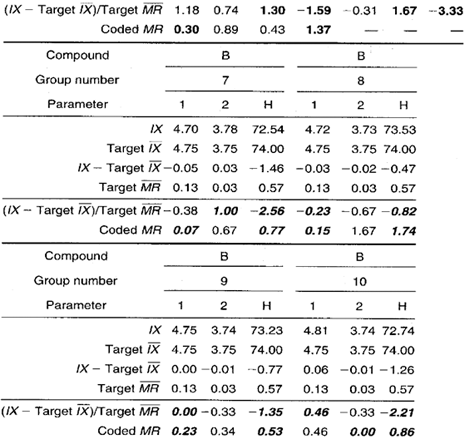
Table 3. Group short run IX-MR chart data collection sheet. MAX and MIN plot points are shown in bold.
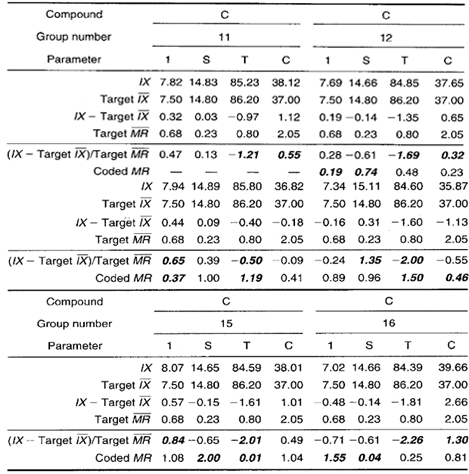
Group Short Run IX-MR Chart
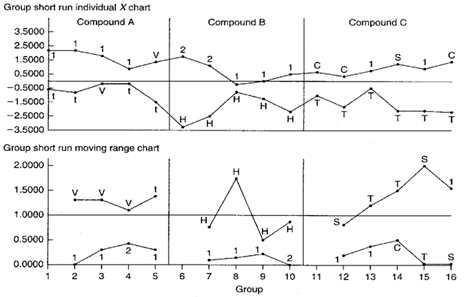
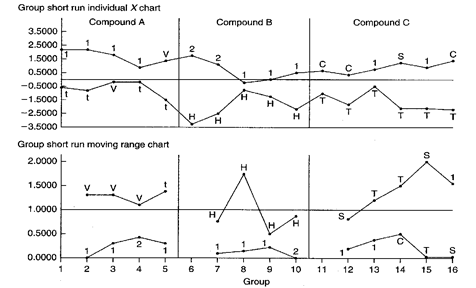
Figure 2. Group short run IX-MR chart for three different compounded adhesive solutions.
Chart Interpretation
Group short run MR chart: There is a run of four consecutive hardness (H) plot points in the MAX position from compound B. This indicates that there is significantly more variation in the hardness characteristic than others.
Also, the first 10 MIN plot points are all chemical concentrations. This indicates that the chemical concentration characteristics exhibit the lowest variability of the characteristics being evaluated regardless of the compound.
Group short run IX chart: All but one of the MAX plot points from compounds A and B represent chemical concentrations. This means that the chemical concentrations are higher on average than their targets.
All of the MIN plot points for compound B represent the hardness characteristic (H). This run indicates that the average hardness is less than its target.
The set time (t) from compound A is in the MIN position four out of five times. This may indicate that the set time is generally quicker than its target time of 17.5 minutes.
Lastly, the reactant temperature from compound C is consistently in the MIN position indicating lower than target temperatures.
Recommendations
- The MIN plot point run of chemical concentrations on the moving range chart appears to be significant. It indicates that the standard deviations are consistently less than expected by the established target MR. Therefore, identify the cause for this improvement and update the target values.
- The MAX plot point run of chemical concentrations on the IX chart appears to be significant. The actual concentrations are consistently higher than expected by the target IX. Therefore, identify the cause(s) for these high concentrations and bring them closer to target. However, if the concentration levels were intentionally run high, the target IX values should be updated to reflect the desired concentration levels. The hardness (if) of compound B found on the group short run IX chart is consistently less than its target IX. Therefore, identify the cause and change the process to bring the hardness closer to target.
- The set time for compound A is a little faster than its target value. If this is an improvement, update the target.
- The reactant temperature (T) of compound C on the group short run IX chart is consistently less than its target value. Process personnel should attempt to do what is necessary to bring the temperature back up to target or determine if the present temperature level is desirable. If it is desirable, then the target temperature value should be updated.
Estimating the Process Average
Estimates of the process average are calculated separately for each characteristic of each compound on the short run group chart. This is illustrated in Calculation 1 using the percent solids (S) from compound C.
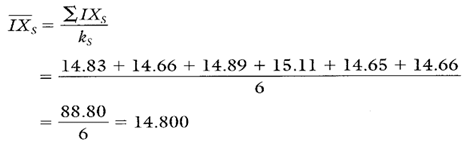
Calculation 1. Estimate of the process average percent solids content(s) from compound C.
Estimating Sigma
In estimating sigma, calculations must be performed separately for each characteristic of each compound on the group short run chart. Notice, however, that no moving ranges have been calculated—only coded MR values are shown in Table 3.
MR values should be calculated using consecutive IX values just as is done with IX-MR charts. So, in Calculations 2 and 3 and in Table 4, standard MR values have been used in calculating estimates of sigma.
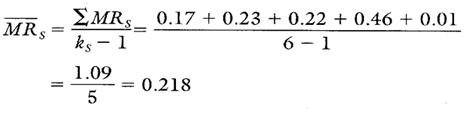
Calculation 2. Average moving range for percent solids content from compound C to be used in the estimate of process standard deviation in Calculation 3.
Calculation 3. Estimate of the process standard deviation for percent solids content from compound C.
Note: To ensure reliable estimates of both the process average and process standard deviation, k needs to be at least 20. In this example, k is only six. Therefore, the estimates here and in Table 4 are shown only for illustration purposes.
Calculating Process Capability and Performance Ratios
Calculation 4. Cp for percent solids content from compound C.
Calculation 5. Cpk upper for percent solids content from compound C.
Calculation 6. Cpk lower for percent solids content from compound C.
Group Short Run IX-MR Chart Advantages
- Graphically illustrates the variation of multiple products and their characteristics simultaneously on the same chart.
- Characteristics from different parts with different means, different standard deviations, and different units of measure can all be analyzed on the same chart.
- Illustrates variation of the process and variation of the specific products.
Group Short Run IX-MR Chart Disadvantages
- No visibility of the characteristics that fall between the MAX and MIN plot points.
- IX, MR, and estimates of sigma must be calculated separately for each characteristic on the chart.
- Analysis and recommendations can be tricky if target origins are not known.
Additional Comments About the Case
Additional statistics and process capability and performance calculations for compound C’s chemical 1, clarity, and reactant temperature are shown in Table 4.
The largest cause for compound C’s rejections is due to reactant temperature failures. Based on the Cpkl of –0.06, more than 50 percent of the batches will fall below the lower specification. With failures this large, one of two actions ought to be considered.
- Change the process to ensure a higher average reactant temperature. This might be a good time to perform a designed experiment to help determine what to change in the process.
- Reexamine the need for the LSL to remain at 85°. If it can be lowered without compromising adhesive performance, change the specification and allow the average temperature to remain at its current level of 84.91°.
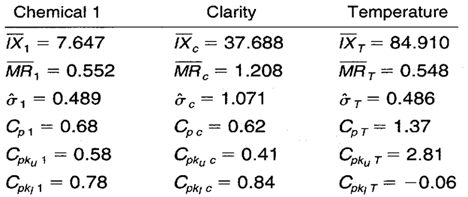
Table 4. Process capability and performance calculations for compound C’s chemical 1, clarity, and reactant temperature.
FOOTNOTE: 1 Wise, Stephen A. and Douglas C. Fair. Innovative Control Charting: Practical SPC Solutions for Today’s Manufacturing Environment. Milwaukee, WI: ASQ Quality Press.
Group Target IX-MR Chart Example
Spot sources of variation unique to a process, product, and characteristic—on a single chart.
How Do You Use Group Target IX-MR Charts?
Group target individual X and moving range (IX-MR) charts combine the insights of a group IX-MR chart and a target IX-MR chart to provide statistically valid information from multiple part numbers or characteristics that have a common process. Review the following example—an excerpt from Innovative Control Charting1—to get a sense of how a group target IX-MR chart works.
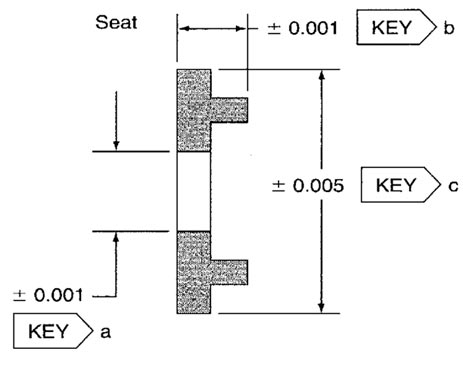
Figure 1. Three generic key characteristics for the seat product line.
Case Description
Three generic key characteristics are monitored on several different seat products. All seats share three common key characteristics and tolerances.
- Key a, inside diameter (nominal + 0.001)
- Key b, length (nominal + 0.001)
- Key c, OD (nominal + 0.005)
Seats are manufactured in many different sizes. In this example, three different seat product series (the -400, -800, and -900) will be evaluated. Each of the three seat series is machined on the same lathe but with different tools. Each characteristic is a different size, but the standard deviations are expected to be similar. The shop supervisor wants to analyze the stability of all three key characteristics, regardless of series number, on one chart (see Table 1).
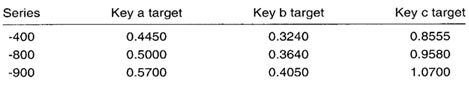
Table 1. Key target values for the three different seat product series.
Bring SPC Charts Up to Speed
This example provides a deep dive into the manual calculations behind the group target IX-MR chart. InfinityQS® solutions—ProFicient™ and Enact®—automate chart creation and help you optimize processes faster.
Sampling Strategy
Given low production volume and multiple characteristics of different sizes, a group target IX-MR chart is selected. This chart will help operators evaluate the variation due to the lathe and variation specific to each characteristic/product series combination. The data in Table 2 represent measurements taken at the lathe every hour in subgroup sizes of one.
Data Collection Sheet
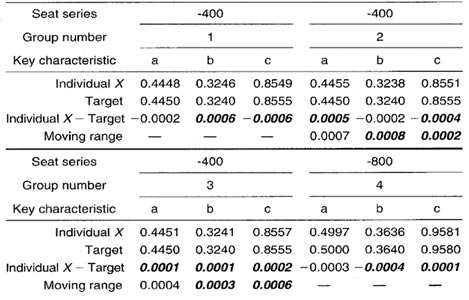
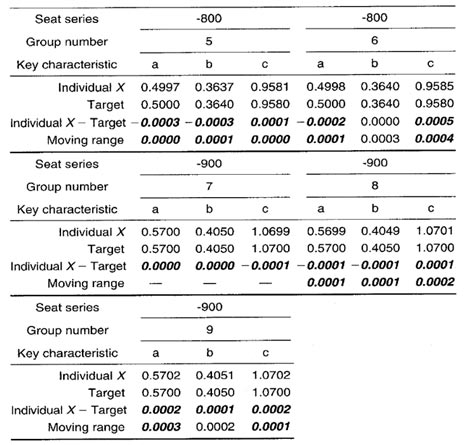
Table 2. Group target IX-MR data and plot points (shown in bold) for the three seat product line characteristics.
Plot Point Calculation
Group MR chart: Moving range values are calculated by taking the absolute value between individual measurements from consecutive groups for the same location. For example, location a in group 2 is 0.4455 and location a in group 1 is 0.4448, so the MR between the two groups is 10.4455 — 0.44481 = 0.0007. MAX and MIN values within each group are used as plot points.
Group Target IX-MR Chart
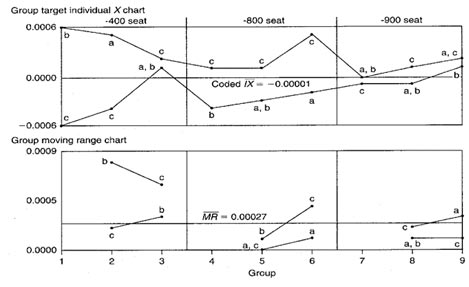
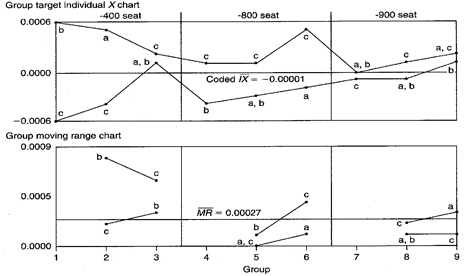
Figure 2. Group target IX-MR chart used to evaluate three different key characteristics from three similar parts.
Chart Interpretation
Group MR chart: MAX and MIN plot points from consecutive groups appear to be descending over time. This could be the result of either
- The standard deviation getting smaller over time regardless of part number
- The -400 series parts exhibiting more variability than either the -800 or -900 series seats
With more data, this initial observation could be confirmed or rejected.
Group target IX chart: Key characteristic c appears in the MAX position six out of nine times. Because this is true across all three part series, it may indicate a condition inherent to the process instead of one specific to a part series. Operators speculate it has to do with the lathe’s apparent difficulty in machining the ODs. There might be something unique about why the lathe tends to run ODs a little higher than specified. Or the problem may be attributed to the programmer having written the program to intentionally manufacture the diameters on the high side. Additional investigation will be required to pinpoint the reason for this nonrandom pattern.
Recommendations
- As more data are collected, the operator should pay close attention to key characteristic c (the ODs). Look for reasons why the diameters on all part series might be a little high.
- Look to see if the moving range plot points continue to decrease over time. It is possible that the -400 series key characteristics have larger standard deviations than the -800 or -900 series key characteristics. (The -800 and -900 series are larger parts, which could explain their smaller standard deviations.)
Estimating the Process Average
If all the part series and their characteristics on the IX chart appear to be behaving randomly, a single average of all coded individual values could be used to estimate the overall process average. However, because this was not the case for the seat products here, process averages will need to be estimated for each seat characteristic across all part series. This is done by calculating a coded IX value for each characteristic for all part series. An example for characteristic a is shown in Calculation 1.
Calculation 1. Estimate of the process average for key characteristic a.
Estimating Sigma
Estimates of sigma are also calculated separately for each characteristic on the group chart. Continuing with key characteristic a, see Calculations 2 and 3.
Calculation 2. Calculation of MR for key characteristic a across all seat series.
Calculation 3. Estimate of the process standard deviation for key characteristic a.
Note: To ensure reliable estimates, the number of groups should be at least 20. In this example, the number of groups is only 9. Therefore, these estimates and those found in Table 3 are shown only for illustration purposes.
Calculating Process Capability and Performance Ratios
These ratios are calculated using coded data. The coded target for each characteristic is zero. Calculations for key characteristic a across all three-part series are shown in Calculations 4, 5, and 6.
Calculation 4. Cp calculation for seat key characteristic a.
Calculation 5. Cpk upper calculation for seat key characteristic a.
Calculation 6. Cpk lower calculation for seat key characteristic a.
Group Target IX-MR Chart Advantages
- Graphically illustrates the variation of multiple products and their characteristics simultaneously on the same chart
- Separates sources of variation unique to the process, unique to the product, and unique to a characteristic on a single chart
- Separates variation due to changes in the average from variation due to changes in the standard deviation
Group Target IX-MR Chart Disadvantages
- No visibility of the characteristics that fall between the MAX and MIN plot points
- The use of negative numbers can be confusing
- Cannot detect certain out-of-control conditions because the group charts described here have no control limits
Additional Comments About the Case
Additional statistics and process capability and performance values for key characteristics b and c are shown in Table 3.
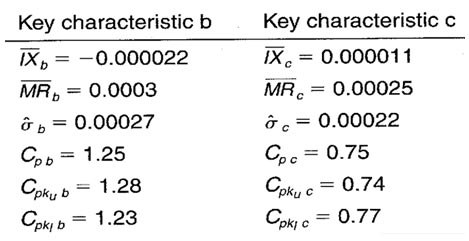
Table 3. Additional statistics and process capability and performance values for key characteristics b and c.
FOOTNOTE: 1 Wise, Stephen A. and Douglas C. Fair. Innovative Control Charting: Practical SPC Solutions for Today’s Manufacturing Environment. Milwaukee, WI: ASQ Quality Press.
Short Run IX-MR Chart Example
Assess process control for short production runs between different part numbers.
Short Run IX-MR Charts
Short run individual X and moving range (IX-MR) charts combine short run data sets to analyze process capabilities in limited production runs. Review the following example—an excerpt from Innovative Control Charting1—to get a sense of how a short run IX-MR chart works.
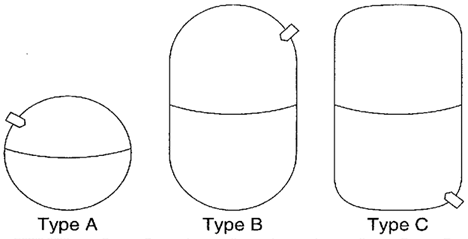
Figure 1. Three fire extinguishing bottles, each with different burst pressure requirements.
Case Description
A certain manufacturer of aerospace fire extinguishing bottles performs destructive testing on each batch of bottles. The test involves pressurizing the bottle until it bursts. Burst pressure is the key characteristic. Each bottle’s burst requirements are different. Also, since each bottle type can be made of different materials with different wall thickness, burst pressure variability changes with each bottle type. For these reasons, a short run IX-MR chart is selected to monitor all data from the burst test. All target values were obtained from past control charts.
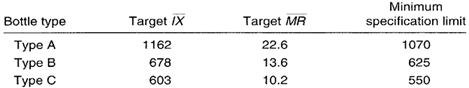
Table 1. Target values and minimum specification limit for all three bottle types.
Bring SPC Charts Up to Speed
This example provides a deep dive into the manual calculations behind the short run IX-MR chart. InfinityQS® solutions—ProFicient™ and Enact®—automate chart creation and help you optimize processes faster.
Sampling Strategy
Since burst testing is destructive, only one bottle from each lot is tested—typically the first piece. However, results from all burst tests are recorded on the same control chart. Tests are immediately performed as first-piece bottles become available. One test stand supports the entire manufacturing operation. Bottle types can change for each test.
Data Collection Sheet
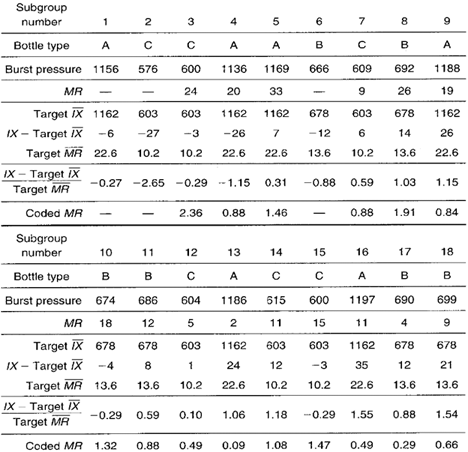
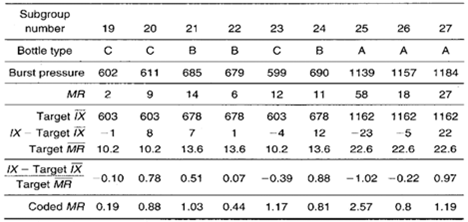
Table 2. Burst test data including plot point calculations for the short run IX-MR chart.
Note: The MR and coded MR values found in Table 2 are calculated using previous data points from the same bottle type. For example, the coded MR value of 0.49 in subgroup 16 is the result of taking the absolute difference between the coded IX values in subgroups 13 and 16: |1.06 — 1.55| = 0.49.
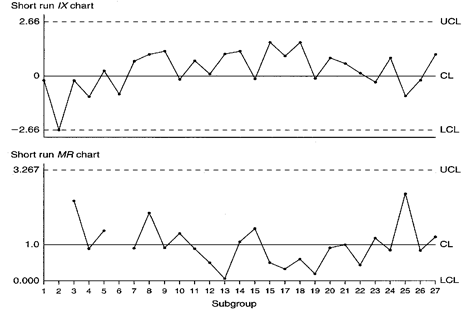
Short Run IX-MR Chart
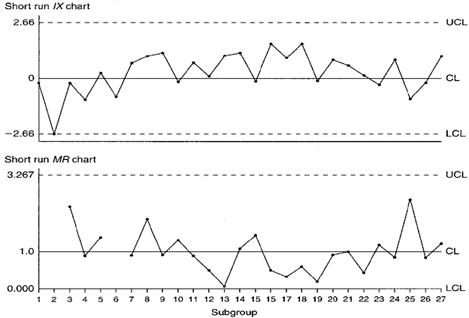
Figure 2. Bottle burst test data short run IX-MR control chart.
Chart Interpretation
Short run MR chart: Because there are no non-random patterns or points outside control limits, the variability in burst pressure is consistent across all three bottle types.
Short run IX chart: The individual plot points appear to be stable with no non-random patterns occurring.
Recommendation
Because both charts are in control, the target values (obtained from past control charts) are still appropriate for the current data. Continue maintaining the control chart with no changes in target values.
Estimating the Process Average
Estimates of the process average should be calculated separately for each characteristic or part on the short run IX and MR chart. In this case, estimates of the process average should be calculated separately for each bottle type. This is illustrated with bottle type A in Calculation 1.
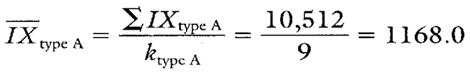
Calculation 1. Estimate of average burst pressure for bottle type A.
Estimating Sigma
Estimates of sigma are also calculated separately for each characteristic or location represented on short run IX-MR charts. In this case, estimates of the standard deviation should be calculated for each bottle type. The calculation of MR for bottle type A is found in Calculation 2.
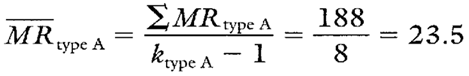
Calculation 2. Calculation of the average moving range for bottle type A (to be used in estimating its standard deviation).
Calculation 3. Estimate of the process standard deviation for bottle type A.
Note: To ensure reliable estimates, k needs to be at least 20. For bottle type A, k is only 9. Therefore, the estimates here and in Table 3 are used for illustration purposes only.
Calculating Process Capability and Performance Ratios
Recall that the minimum specification for bottle type A burst pressure is 1070. Because there is only a single minimum burst specification, Cp and Cpk upper are not calculated.
Calculation 4. Cpk lower calculation for bottle type A burst pressure.
Short Run IX-MR Chart Advantages
- Graphically illustrates the variation of multiple product or process characteristics on the same chart.
- Can chart process parameters that have changing target values. Characteristics from different parts with different means, different standard deviations, and different units of measure can be analyzed on the same chart.
- Pinpoints the characteristics that are in need of the most attention.
- Separates variation due to the process from variation that is product specific.
Short Run IX-MR Chart Disadvantages
- The MR chart is dependent upon consecutive IX chart plot points.
- IX, MR, and estimates of sigma must be calculated separately for each characteristic on the chart.
Additional Comments About the Case
- The case study shown here displayed three bottle types. In the actual situation, there were 22 different bottle types being monitored on the same short run IX-MR chart.
- Process capability and performance calculations for the remaining bottle types are shown in Table 3.
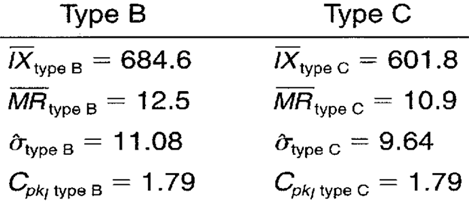
Table 3. Additional summary statistics and process capability and performance ratios for remaining bottle types.
FOOTNOTE: 1 Wise, Stephen A. and Douglas C. Fair. Innovative Control Charting: Practical SPC Solutions for Today’s Manufacturing Environment. Milwaukee, WI: ASQ Quality Press.
Target IX-MR Chart Example
Evaluate process control for part numbers with different target values.
How Do You Use Target IX-MR Charts?
Target charts show multiple characteristics that have different nominal or target values, with a zero point representing the target value of each characteristic. Target individual X and moving range (IX-MR) charts enable you to spot variation in a characteristic and plot several characteristics in the same chart. Review the following example—an excerpt from Innovative Control Charting1—to get a sense of how a target IX-MR chart works.
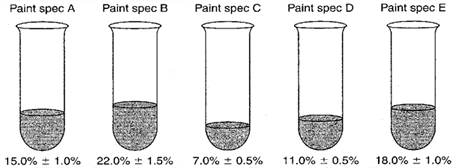
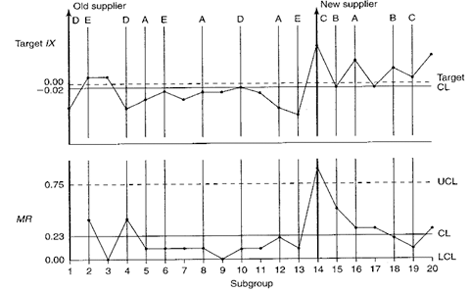
Figure 1. Target percent solids from five different paint specifications.
Case Description
Solids content in paint is a key characteristic. To obtain a measure of solids content, a paint sample of known weight is taken from a mixing tank—one sample per paint batch. The sample is baked in an oven until only solids remain. The remaining solids are weighed and a percent solids is calculated. In this example, a mixing tank is used to produce five different types of paint: A, B, C, D, and E. Each paint type requires a different percent solids content. Long production runs rarely occur with any one paint. The production manager is monitoring the solids content from all five paints on the same SPC chart.
Bring SPC Charts Up to Speed
This example provides a deep dive into the manual calculations behind the target IX-MR chart. InfinityQS® solutions—ProFicient™ and Enact®—automate chart creation and help you optimize processes faster.
Sampling Strategy
A target IX-MR chart is used to monitor this process because
- Only one characteristic is being controlled (solids content).
- One measurement is representative of each batch.
- The user prefers to construct a single chart to track multiple paint specs.
Data Collection Sheet
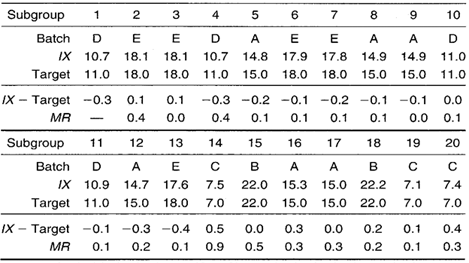
Table 1. Data collection sheet for constructing target IX-MR chart.
Target IX-MR Chart
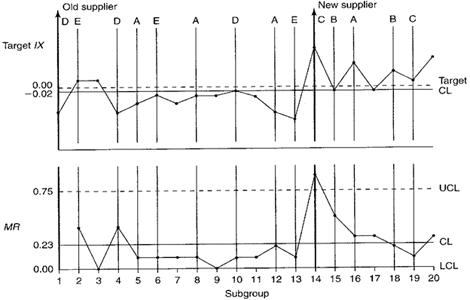
Figure 2. Percent solids target IX-MR chart.
Calculations for the MR Chart
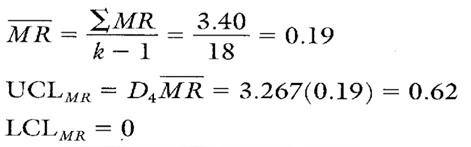
Calculation 1. Calculations for MR chart.
MR Chart Interpretation and Recalculation
An upward spike occurs on the MR chart when the new supplier’s products begin to be used. Because the MR chart is out of control, this means that the value of MR is unreliable and cannot be used to calculate control limits for the target IX chart. This is why no control limits were placed on the target IX chart in Figure 2.
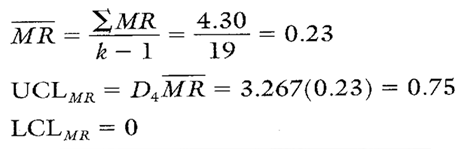
After removing the out-of-control plot point (subgroup number 14) from the MR chart, the MR was recalculated using the remaining 18 MR values (see Calculation 2).
Calculation 2. Revised MR chart calculations after removing subgroup number 14.
Note that all of the remaining moving range values fall within the new MR chart control limits (see Figure 3). There appears to be no indication of assignable causes of variation. Given this situation, it is now appropriate to complete the control chart calculations for the target IX chart.
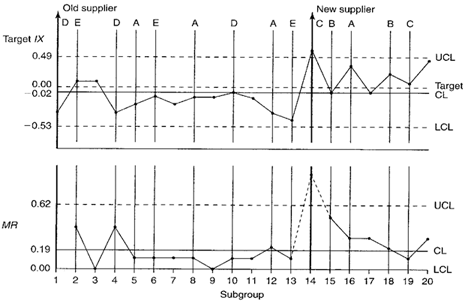
Figure 3. Target IX-MR chart with revised control limits. Subgroup number 14 has been removed from calculations for the MR chart.
Calculations for the Target IX Chart
Calculation 3. Calculations for the percent solids target IX chart.
Target IX Chart Interpretation
It appears that, after the supplier change, the percent solids contents increased across paints A, B, and C. The run above the centerline between plot points 14 and 20 was determined to be the result of changing the supplier. The run below the centerline between points 4 and 9 is, in part, due to the upward shift in the centerline between points 14 and 20.
Recommendation
Supplier changes should not be introduced into the line without first knowing how the change will affect the producibility and/or the finished product. If the effects are known in advance, prior adjustments can possibly be made without affecting the production line. In many cases, the costs associated with changing suppliers exceed the benefits of a lower price.
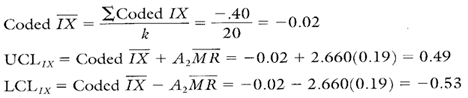
Estimating the Process Average
The coded IX on the control chart (–0.02 percent) has been upwardly influenced because of the supplier change assignable cause. Because of the presence of an assignable cause, the overall average of –0.02 percent is not a reliable estimate of the centering of the process.
To accurately estimate the overall process average, we will evaluate only the data from the old supplier (the first 13 subgroups). This data by itself proved to be in control on a separate target IX-MR chart (not shown here).
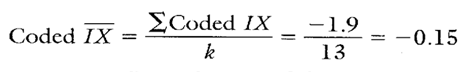
Calculation 4. Estimate of the process average based upon old supplier data (first 13 subgroups).
The coded IX from Calculation 4 shows that, on average, each old supplier batch of paint is approximately 0.15 percent below targets. If enough data were gathered from the new supplier data, it might be interesting to evaluate the old supplier’s coded IX with the new supplier’s IX.
Estimating Sigma
The MR chart for the first 13 subgroups (not shown) proved to be in control. The calculation for MR is shown in Calculation 5.
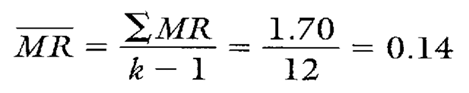
Calculation 5. Average moving range calculation from first 13 subgroups.
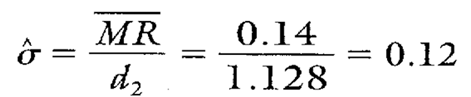
Calculation 6. Estimating sigma using MR from Calculation 5.
Note that the first 13 subgroups represent only old supplier data. Therefore, the sigma found in Calculation 6 can be thought of as the estimated standard deviation for the old supplier. Notice, though, that the first 13 subgroups also are representative of process performance from paint specs A, D, and E. No data representing paint specs B or C are found. Therefore, paint specs A, D, and E will be used in calculating Cp and Cpk values. There will be no calculation of Cp or Cpk values for paint specs B or C.
Calculating Process Capability and Performance Ratios
Capability ratios will be calculated for each paint specification found in the first 13 subgroups. Because the MR chart is in control, the same sigma may be used in calculating process capability and performance ratios for paint specifications A, D, and E. The Cp calculation for paint specification A (assuming the old supplier’s materials are used) is found in Calculation 7.
Calculation 7. Process capability ratio for paint spec A using old supplier data.
In order to calculate CpkA, the process average must first be estimated for paint spec A. The estimate of the paint spec A process average is given in Calculation 8.
Calculation 8. Estimate of the process average for paint spec A.
Calculation 9. Cpk upper calculation for paint spec A.
Calculation 10. Cpk lower calculation for paint spec A.
Because the Cp value is greater than 1, the process is more than capable of producing almost 100 percent acceptable output. Because the Cpk value is smaller than the Cp value, it means that the process is a little off center, but because the Cpk value is larger than 1, the process is performing to specifications.
The Cp and Cpk ratios for paint specs D and E can be found in Table 2.
Target IX-MR Chart Advantages
- Multiple parts, specifications, or characteristics can be plotted on the same chart (provided they all have similar variability as exhibited by an in-control MR chart).
- Cp and Cpk can be calculated for each characteristic on the chart.
- Statistical control can be assessed for both the process and each unique part and/or characteristic on the chart.
Target IX-MR Chart Disadvantages
- When interpreting the target IX chart, both the zero line and the coded X must be taken into account.
- The MR plot points are dependent on the IX plot points. In other words, changes in the MR chart are directly related to changes from one individual measurement to the next.
- Variation in the individual measurements could be caused by a shift in the average or the inherent standard deviation of the process; however, the IX-MR charts cannot efficiently separate the effects of the two.
- Reliable control limits require the distribution of the individual measurements to be approximately normal.
- The target IX-MR chart is not as sensitive to changes in the process average or standard deviation as would be a target Xbar-R chart.
Additional Comments About the Case
Cp and Cpk for paint specifications D and E are shown in Table 2.
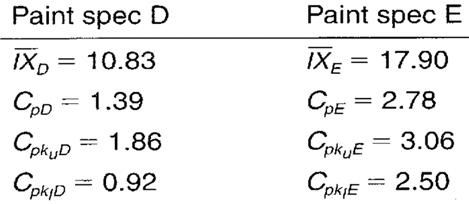
Table 2. Cp and Cpk values for paint specifications D and E.
FOOTNOTE: 1 Wise, Stephen A. and Douglas C. Fair. Innovative Control Charting: Practical SPC Solutions for Today’s Manufacturing Environment. Milwaukee, WI: ASQ Quality Press.
Speak to a Manufacturing Industry Expert
What to Expect
- Free 20-minute call with a product expert
- Explore which solutions best suit your needs
- No-pressure conversation
- Get a live, personalized demo