Xbar and Range (Xbar-R) Chart
Learn how to use this combined view to track variation across across a single characteristic—and pinpoint issues at a glance.

SPC DEMO
Don’t miss out! Book a demo of our specialized SPC software and unlock immediate improvements in your processes.
What are the Components of the Xbar and Range Chart?
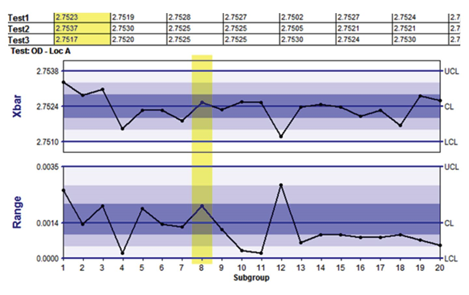
The Xbar chart—the upper section in this statistical process control (SPC) chart—plots the average of individual values in a subgroup (i.e., the subgroup mean). The Range chart (R)—(the lower section in the chart— plots the difference (or range) between the maximum and minimum individual values within the subgroup.
Xbar-R Charts for a Single Characteristic
An Xbar-R chart is a quality control chart used to plot subgroup means and ranges of individual values from a single characteristic on a given part that were all produced on the same machine. A traditional Xbar-R chart is a single stream of data for a unique Part/Process/Test combination.
For example, this chart (taken from InfinityQS® ProFicient™ software) shows 20 subgroups. The highlighted section shows that both the average and range plot points for subgroup 8 are well within control limits. Judging from the control chart as a whole, this process is consistent (no plot points fall outside control limits) and only common cause variation is present.
Scroll down to learn how to use this chart.
Automate and Simplify Control Chart Analysis
See how easy it is to access actionable information from your SPC control charts.
When to Use the Xbar-R Chart
Use the Xbar-R chart when the sample size is between 2 and 9 (typically 3 or 5). This chart is often used when at least a few parts are made every hour and you can collect data at a reasonable cost.
The special use examples discussed for this chart all deal with sample sizes between 2 and 9.
Advantages and Disadvantages of Using the Xbar-R Chart
Advantages
- Easy to read and understand
- Widely recognized; operates on principles that serve as the foundation for more advanced control charts
- Separates variation in averages from variation in standard deviation
Disadvantages
- Must use a separate chart for each characteristic
- Only two values per subgroup are used to estimate the standard deviation for the range, regardless of sample size
- Cannot be used to accurately indicate process variability for sample sizes greater than 9
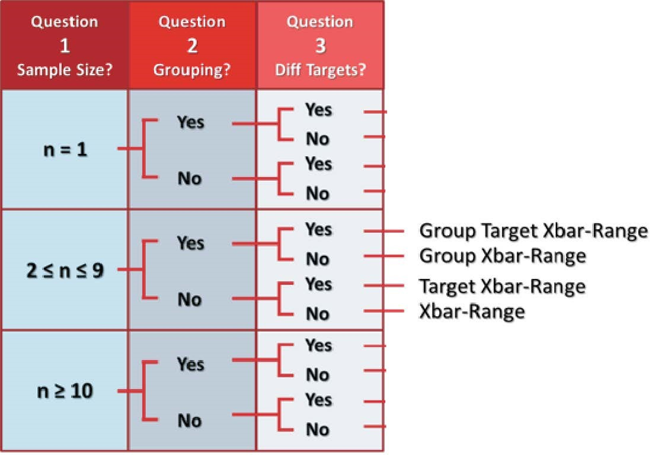
Decision Tree
Use the following decision tree to determine whether the Xbar-R chart is the best choice.
Scroll down to see special use examples.
Special Uses
Today, control charts are a key tool for quality control and figure prominently in Lean manufacturing and Six Sigma efforts.
Target Xbar-R Chart
Target Xbar-R charts can help you identify changes in the average and range of averages of a characteristic. You can measure the characteristic across part numbers, but each part number must form a separate subgroup because target values change with the part number. Set the target values at the desired center, typically the center two-sided specifications.
- Plot multiple parts, characteristics, or specs on the same chart, as long as variability is similar across all parts, characteristics, or specifications.
- Plot data from gauges that are zeroed out on target values without needing to code or transform the data.
- Assess statistical control for both the part (or characteristic) and the process.
Short Run Xbar-R Chart
Short run charts are used for short production runs. The short run Xbar-R chart can help you identify changes in the averages and range of averages of multiple characteristics, even those with different nominals, units of measure, or standard deviations.
- Use one chart to detect variations across multiple process or product characteristics, even for parts that have different means, units of measure, or standard deviation.
- Identify characteristics that should be prioritized for attention.
- Easily separate process- and product-specific variations as well as variations that are caused by changes in a subgroup mean and those that are caused by changes in the standard deviation.
Group Xbar-R Chart
Group Xbar-R charts help you assess changes in averages and the range of averages across measurement subgroups for a characteristic.
- Easily identify characteristics that need priority attention.
- Easily separate process- and product-specific variations as well as variations that are caused by changes in a subgroup mean and those that are caused by changes in the standard deviation.
- Track multiple characteristics on the same chart.
Group Target Xbar-R Chart
The group target Xbar-R chart provides information about changes in process averages and the range of averages across multiple measurement subgroups of similar characteristics that have a common process. Part numbers and engineering nominal values can differ across these characteristics.
- Track multiple characteristics or similar characteristics with different averages on the same chart.
- View both product and process characteristic variations.
- See the difference between variations that are caused by changes in average and those caused by changes in the standard deviation.
Group Short Run Xbar-R Chart
When you need to evaluate changes in the process average and range of averages across multiple characteristics in a short run environment, use the group short run Xbar-R chart.
- See the variations of multiple process or product characteristics on one chart, even within short production runs.
- Analyze characteristics from multiple parts with different means, standard deviations, and units of measure.
- Easily separate process- and product-specific variations as well as variations that are caused by changes in a subgroup mean and those that are caused by changes in the standard deviation, even in short run environments.
Group Short Run Xbar-R Chart Example
Simplify process monitoring by representing data for multiple parts and multiple characteristics on one chart.
How Do You Use Group Short Run Xbar-R Charts?
Group short run Xbar and range (Xbar-R) charts can help you evaluate changes in the process average and range of averages across multiple characteristics in a limited production run. Review the following example—an excerpt from Innovative Control Charting1—to get a sense of how a group short run Xbar-R chart works.
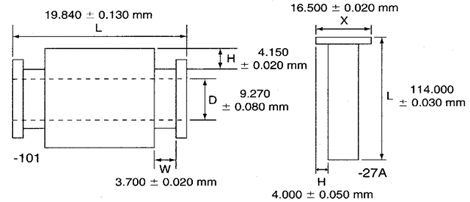
Figure 1. Two parts containing multiple key characteristics.
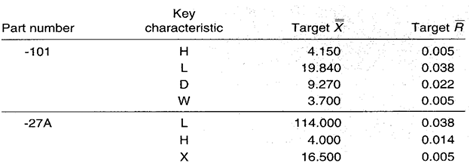
Table 1. Key characteristics with respective target values.
Case Description
A single lathe produces many different part numbers, each with many different key characteristics. The two parts shown in Figure 1 are examples. The manager of the machine shop wants to use only one chart for each lathe to monitor the process regardless of the part numbers or key characteristics being produced.
Bring SPC Charts Up to Speed
This example provides a deep dive into the manual calculations behind the group short run Xbar-R chart. InfinityQS® solutions—ProFicient™ and Enact®—automate chart creation and help you optimize processes faster.
Sampling Strategy
The same chart must allow for different part numbers and different key characteristics. Because each characteristic may be unique with respect to its nominal, tolerance, and unit of measure, a group short run Xbar-R chart is selected. This chart will separate variation due to the lathe from variation unique to each part and characteristic.
The cycle time varies, but lot sizes are typically 20 to 100 parts. Cutting tools are replaced about every three hours. The data represent measurements taken every fifteenth part regardless of the part number (n = 3).
Data Collection Sheet
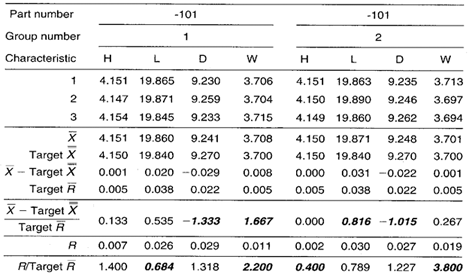
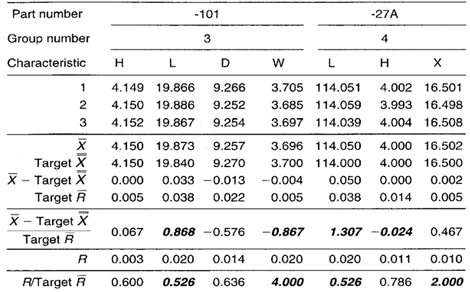
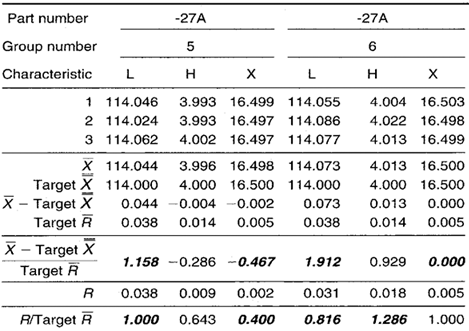
Table 2. Data collection sheet for the group short run Xbar-R chart lathe example. MAX and MIN plot points are shown in bold.
Group Short Run Xbar-R Chart
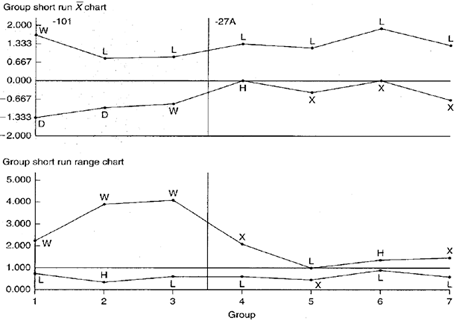
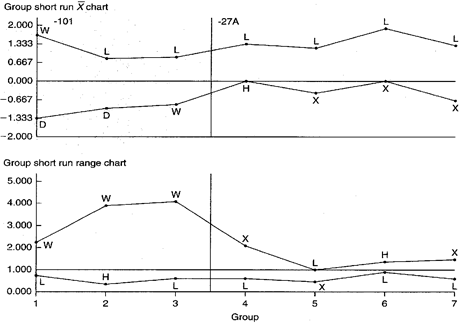
Figure 2. Group short run Xbar-R charts representing two parts and multiple characteristics.
Chart Interpretation
Group short run range chart: During the -101 part run, key characteristic width W appears in the MAX position all three times. There is a possibility of this happening by chance if all four keys are behaving randomly about their target values, but this may be an indicator of significantly greater variability in the W dimension as compared with others.
The L dimension appears in the MIN position five out of seven times. This likely represents a nonrandom pattern indicating less variability in the L dimension across both parts.
Group short run Xbar chart: The L characteristic on both the -101 and -27A appears in the MAX position six out of seven times. The chance of this occurring randomly is very small. This is most likely a nonrandom pattern that is related to the process itself. That is, regardless of the part number, the process tends to cut lengths on the high side.
During the manufacture of the -27A part, the rim of three plot points in the MIN position for dimension X may indicate the presence of a nonrandom pattern.
Recommendations
- Operators and process engineers should try to identify why the lathe tends to cut all part lengths on the high side and why the W dimension on the -101 part displays more relative variation than the other three key characteristics. In addition, operators and engineers should try to isolate the reason why the L dimension varies less than other dimensions.
- Watch the X dimension on the -27A part and subsequent part numbers. If the dimension continues to fall in the MIN position on the group short run Xbar chart, there should be an investigation for nonrandom patterns that relate to process-specific causes. If, however, the X dimension fails to fall into the MIN position for subsequent part numbers, the cause should be treated as product specific.
Estimating the Process Average
Estimates of the process average are calculated separately for each characteristic for each part on the group short run charts. This is illustrated in Calculation 1 using data from the H dimension on the -27A part.
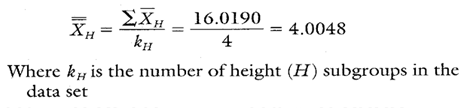
Calculation 1. Estimate of the process average for characteristic H on part -27A.
Estimating Sigma
Estimates of sigma are also calculated separately for each characteristic on each part on the group short run charts. Continuing with characteristic H, sec Calculations 2 and 3.
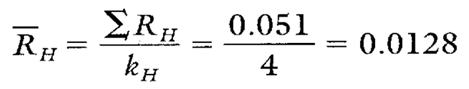
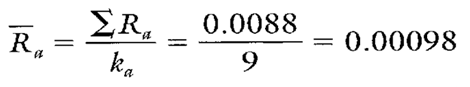
Calculation 2. R calculation for characteristic H on part -27A.
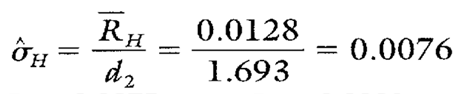
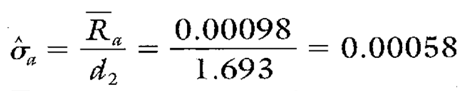
Calculation 3. Estimate of the process standard deviation for characteristic H on part -27A.
Note: To ensure reliable estimates, k needs to be at least 20. In this example, k is only four. Therefore, the estimates shown here and in Table 3 are used only for illustration purposes.
Calculating Process Capability and Performance Ratios
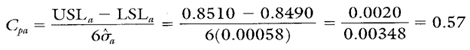
Calculations 4, 5, and 6 show the process capability and performance calculations for characteristic H.
Calculation 4. Cp calculation for characteristic H.
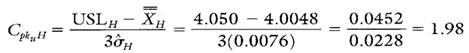
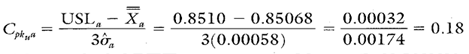
Calculation 5. Cpk upper calculation for characteristic H.
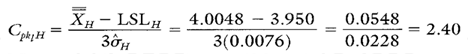
Calculation 6. Cpk lower calculation for characteristic H.
Group Short Run Xbar-R Chart Advantages
- Graphically illustrates the variation of multiple product or process characteristics on the same chart.
- Characteristics from different parts with different means, different standard deviations, and different units of measure can be analyzed all on the same chart.
- Separates variation due to changes in the average from variation due to changes in the standard deviation.
- Separates variation due to the process from variation specific to a product characteristic.
Group Short Run Xbar-R Chart Disadvantages
- No visibility of characteristics that fall between the MAX and MIN plot points.
- Cannot detect certain out-of-control conditions because the group charts described here have no control limits.
- Many calculations are required to code the data.
Additional Comments About the Case
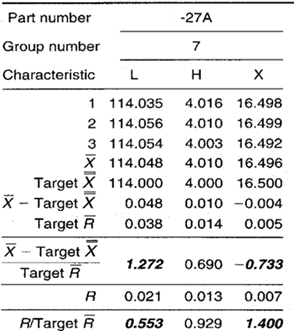
- Additional statistics and process capability and performance calculations for part characteristic L and X for part -27A are shown in Table 3.
- Notice that characteristic L, while not capable, has a negative Cpku L value. This indicates that XL falls outside of the upper specification limit. In fact, the average falls more than 0.020 mm outside of the USL of 114.03 mm. This underscores the importance of reacting to characteristic L’s nonrandom pattern shown on the group short run Xbar chart in Figure 2.
- Characteristic X has Cp and Cpk values that arc not only greater than one, but very close, numerically to one another. Therefore, characteristic X is capable and its Xx is almost perfectly centered on its engineering nominal value of 16.500 mm.
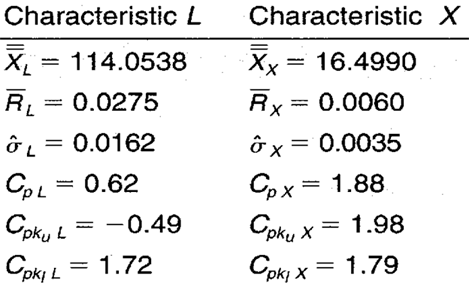
Table 3. Additional statistics and process capability and performance ratios for characteristics L and X from part -27A.
FOOTNOTE: 1 Wise, Stephen A. and Douglas C. Fair. Innovative Control Charting: Practical SPC Solutions for Today’s Manufacturing Environment. Milwaukee, WI: ASQ Quality Press.
Group Target Xbar-R Chart Example
Get visibility into process and part variability at a granular level.
How Do You Use Group Target Xbar-R Charts?
Group target Xbar-R charts provide information about changes in process averages and the range of averages across multiple measurement subgroups of similar characteristics that have a common process. Review the following example—an excerpt from Innovative Control Charting1—to get a sense of how a group target Xbar-R chart works.
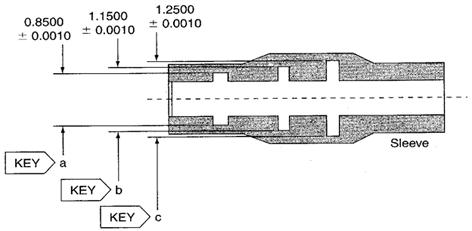
Figure 1. Three sleeve-inside-diameter key characteristics.
Case Description
This sleeve contains three inside diameter key characteristics. They are all machined on the same lathe but with different tools. Each inside diameter is a different size. The customer requires stability of the lathe process as well as capability information from each inside diameter.
Bring SPC Charts Up to Speed
This example provides a deep dive into the manual calculations behind the group target Xbar-R chart. InfinityQS® solutions—ProFicient™ and Enact®—automate chart creation and help you optimize processes faster.
LEARN MORE ABOUT MODERN SPC SOLUTIONS.
Sampling Strategy
Visibility is required of both process and part variability. Because the same type of characteristic (sleeve diameters) with different targets is being measured at multiple locations on the same part, a group target Xbar-R chart is selected. This chart will highlight both variation in the lathe and variation in each of the three sleeves.
The cycle time required to manufacture a sleeve is three minutes. Cutting tools are replaced about every two hours. The subgroups represent measurements taken every hour from three consecutive sleeves.
Data Collection Sheet
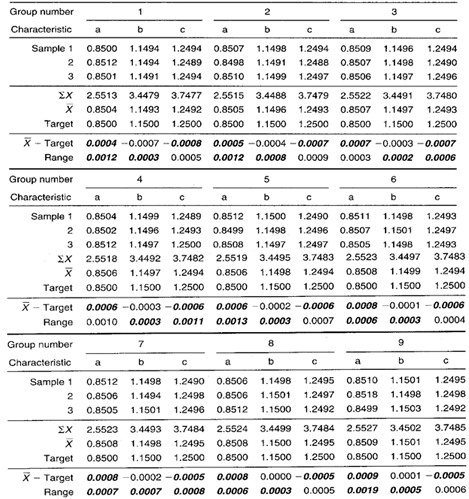
Table 1. Group target Xbar-R chart data for three sleeve characteristics. MAX and MIN plot points are shown in bold.
Group Target Xbar-R Chart
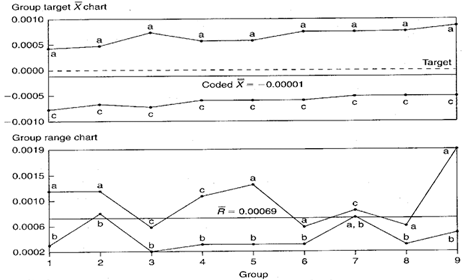
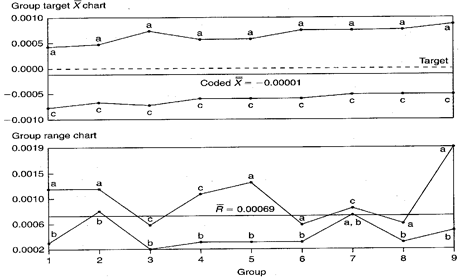
Figure 2. Group target Xbar-R chart representing three different sized inside-sleeve diameters.
Chart Interpretation
Group target range chart: Either characteristic a or c shows up in the MAX position in every group. This suggests that these two locations have the largest standard deviation values. Location b appears in the MIN position in every group. This means that, of the three diameters being evaluated, location b has the least variability.
Group target Xbar chart: Diameter a dominates the MAX position. It consistently deviates from its target (to the high side) more than the other diameters. Location c dominates the MIN position. It consistently deviates from its target (to the low side) more than the other diameters. Diameter b falls in between. It deviates from its target value less than diameters a or c. This is characteristic of taper in the diameters. Also, notice that the MAX and MIN lines are somewhat parallel and seem to gradually trend upwards.
Recommendations
- Operators should find out why the diameters on the ends (a and c) have larger standard deviations. One might evaluate the cutting tools, the way the sleeve is held when machined, part loading techniques, wall thicknesses at the different locations, coolant flow, or measurement problems.
- People working in the process should try to eliminate the taper among the diameters. Change the process so that the a and c diameters fall closer to their targets.
- The upward trend on the Xbar chart appears to be a predictable tool wear condition. One may consider performing a regression analysis to estimate when the cutting tools should be replaced.
Estimating the Process Average
If all of the key characteristics on the group target Xbar chart appeared to be behaving randomly, a single estimate of the process average could be used to estimate the process average for all locations. However, in this case, the group target Xbar chart does not exhibit random behavior.
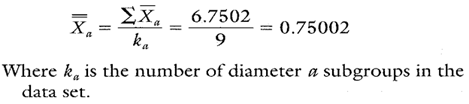
Given this nonrandom behavior on the group target Xbar chart, estimates of the process average should be calculated separately for each characteristic on the group target chart. This is illustrated in Calculation 1 using data from diameter a.
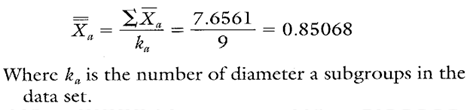
Calculation 1. Estimate of the process average for diameter a.
Estimating Sigma
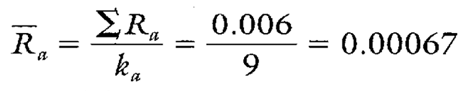
Estimates of sigma arc also calculated separately for each characteristic on the group chart. Continuing with diameter a, see Calculations 2 and 3.
Calculation 2. Calculation of R for use in estimating the process standard deviation for diameter a.
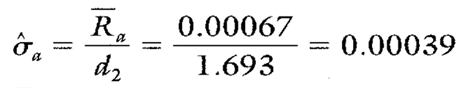
Calculation 3. The estimate of the process standard deviation for diameter a.
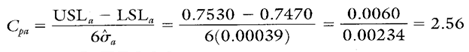
Calculating Process Capability and Performance Ratios
Calculations 4, 5, and 6 show the process capability and performance calculations for diameter a.
Calculation 4. Cp calculation for diameter a.
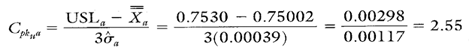
Calculation 5. Cpk upper calculation for diameter a.
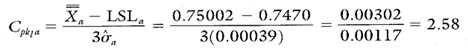
Calculation 6. Cpk lower calculation for diameter a.
Group Target Xbar-R Chart Advantages
- Simultaneously illustrates the variation of multiple product or process characteristics.
- Similar characteristics with different averages can be analyzed on the same chart.
- Separates variation due to changes in the average from variation due to changes in the standard deviation.
- Multiple characteristics can be tracked on one chart.
Group Target Xbar-R Chart Disadvantages
- No visibility of the characteristics that fall between the MAX and MIN plot points.
- The use of negative numbers can be confusing.
- Cannot detect certain nonrandom conditions because the group charts described here have no control limits.
Additional Comments About the Case
- The remaining process statistics and process capability and performance ratios for diameters b and c are shown in Table 2.
- Diameter a is not capable. Its average is greater than its target by almost 0.0007″.
- Diameter b is capable although its average is more than 0.0002″ lower than its target.
- Diameter c is not capable and its average is more than 0.0006″ lower than its target.
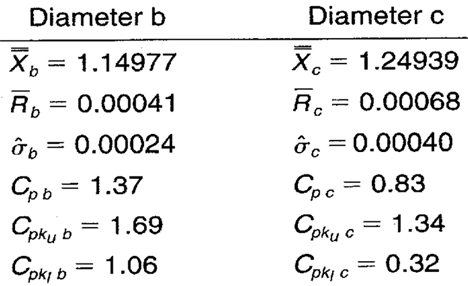
Table 2. Additional statistics and process capability and performance values for diameters b and c.
FOOTNOTE: 1 Wise, Stephen A. and Douglas C. Fair. Innovative Control Charting: Practical SPC Solutions for Today’s Manufacturing Environment. Milwaukee, WI: ASQ Quality Press.
Group Xbar-R Chart Example
Check uniformity of multiple key characteristics on a single chart.
How Do You Use Group Xbar-R Charts?
Group Xbar and range (Xbar-R) charts help you assess changes in averages and the range of averages across measurement subgroups for a characteristic. Review the following example—an excerpt from Innovative Control Charting1—to get a sense of how a group Xbar-R chart works.
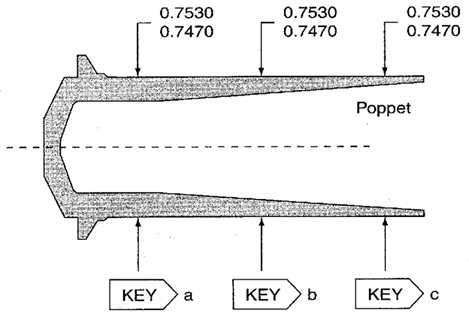
Figure 1. Three OD key characteristics on a poppet.
Case Description
A poppet is manufactured on a screw machine. Rejection rates due to inconsistent ODs have been unacceptably high. Therefore, uniformity of the OD is designated as a key characteristic. To check the uniformity, three OD measurements arc taken on each poppet at locations a, b, and c. Although the dimensions of the poppet could also be monitored using three separate Xbar-R charts—one for each dimension—quality assurance wants to monitor the diameter using only one chart. This is why the group Xbar-R chart is selected.
Bring SPC Charts Up to Speed
This example provides a deep dive into the manual calculations behind the group Xbar-R chart. InfinityQS® solutions—ProFicient™ and Enact®—automate chart creation and help you optimize processes faster.
LEARN MORE ABOUT MODERN SPC SOLUTIONS.
Sampling Strategy
Because the same characteristic is being measured at three different locations on the same part, a group Xbar-R chart is selected. Three poppets are measured every 15 minutes.
Data Collection Sheet
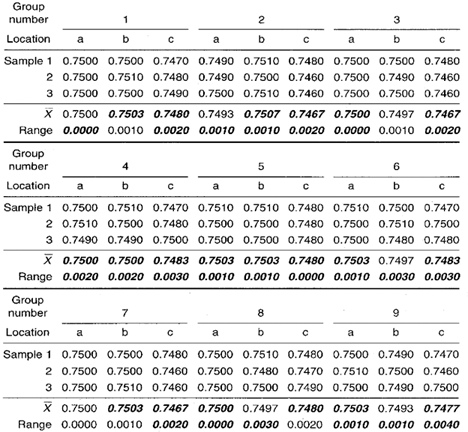
Table 1. Data collection sheet for the group Xbar-R chart. MAX and MIN plot points for each group are displayed in bold.
Group Xbar-R Chart
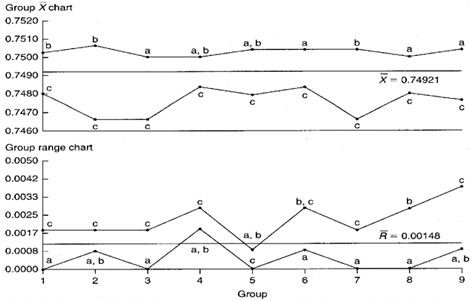
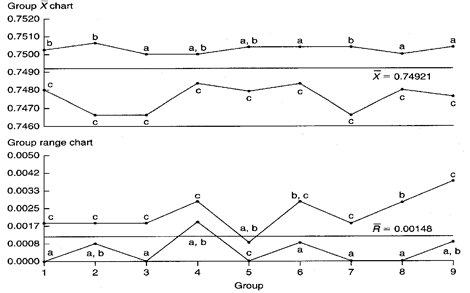
Figure 2. Group Xbar-R charts representing three ODs on the same part.
Chart Interpretation
Group range chart: Location c appears in the MAX position seven out of nine times. This strongly suggests that location c has the largest standard deviation. Location a appears eight out of nine times in the MIN position, therefore, location a most likely has the smallest standard deviation. The value of location b’s standard deviation falls somewhere between the value of the standard deviation of locations a and c.
Group Xbar chart: Locations a and b are in the MAX position six times and five times respectively. This sharing of the MAX position means that the average diameters of a and b behave similarly and they are always larger than location c, which appears nine out of nine times in the MIN position.
Recommendations
- These charts illustrate the lack of uniformity in the popper CD. The first recommendation is to change the process so that location c’s diameter increases enough to be in line with the size of the diameters at locations a and b. This might be done by reworking the cam or changing the program on the screw machine.
- The large amount of variation at location c should also be addressed. To do this, operators might try a different way of positioning the work piece material in the holding fixture or find a different way to machine the dimension at location c.
Estimating the Process Average
Process average estimates should be performed separately for each characteristic or location on the group chart (see Calculation 1).
Calculation 1. Estimate of the process average for location a.
Estimating Sigma
Estimates of sigma are also calculated separately for each characteristic or location on the group chart. Continuing with location a, see Calculations 2 and 3.
Calculation 2. Calculation of R for location a.
Calculation 3. Estimated standard deviation for location a.
Calculating Process Capability and Performance Ratios
Calculations 4, 5, and 6 show the process capability and performance calculations for location a.
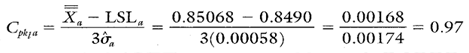
Calculation 4. Cp calculation for location a.
Calculation 5. Cpk upper calculation for location a.
Calculation 6. Cpk lower calculation for location a.
Group Xbar-R Chart Advantages
- Multiple characteristics can be tracked on one chart.
- Pinpoints the characteristics that are most in need of attention.
- Separates variation due to changes in the average from variation due to changes in the standard deviation.
Group Xbar-R Chart Disadvantages
- No visibility of the characteristics that fall between the MAX and MIN plot points
- Cannot detect certain out-of-control conditions because the group charts described here have no control limits
Additional Comments About the Case
The process capability and performance calculations for locations b and c are shown in Table 2.
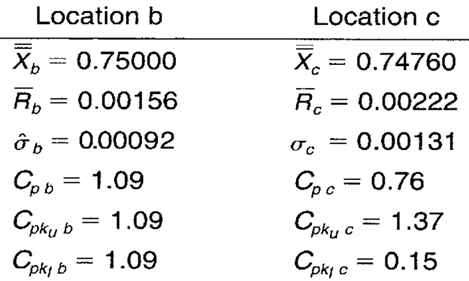
Table 2. Additional summary statistics and process capability and performance ratios.
FOOTNOTE: 1 Wise, Stephen A. and Douglas C. Fair. Innovative Control Charting: Practical SPC Solutions for Today’s Manufacturing Environment. Milwaukee, WI: ASQ Quality Press.
Short Run Xbar-R Chart Example
Evaluate process control for short production runs and different part numbers.
How Do You Use Short Run Xbar-R Charts?
Short run X-bar and range (Xbar-R) charts can help you identify changes in the averages and range of averages of multiple characteristics—even those with different nominals, units of measure, or standard deviations—in limited production runs. Review the following example—an excerpt from Innovative Control Charting1—to get a sense of how a short run Xbar-R chart works.
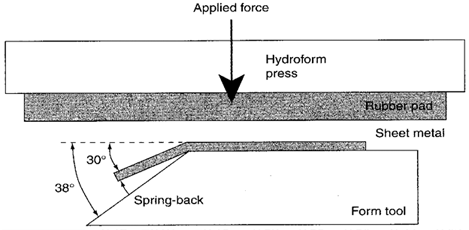
Figure 1. Example of sheet metal spring-back after hydroform operation.
Case Description
A hydroform is used to form angles in sheet metal. This is done by compressing a piece of sheer metal between a rubber pad and a form tool. When the metal is bent on the form tool, it springs back a few degrees when the pressure is released. To counteract the spring-back effect, the form tool angle exceeds the desired angle. In this case, the desired resultant sheet metal angles are 30°, 45°, and 90°. The average spring-back and standard deviations are different for each angle. The production foreman wants to use one control chart to monitor the spring-back behavior of all three types of angles. Table 1 shows the spring-back target values and specifications.
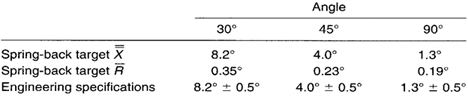
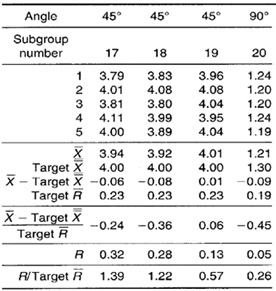
Table 1. Spring-back target values and specifications for three types of angles.
Note: The target X values are based on engineering nominal values and the target R values are based on historical quality records.
Bring SPC Charts Up to Speed
This example provides a deep dive into the manual calculations behind the short run Xbar-R chart. InfinityQS® solutions—ProFicient™ and Enact®—automate chart creation and help you optimize processes faster.
LEARN MORE ABOUT MODERN SPC SOLUTIONS.
Sampling Strategy
The hydroform machine is initially set up to bend 45° angles. Five consecutive spring-back measurements are taken every hour until the job is complete. Next, the machine is set up to run 30° angles and so on. Sampling continues in the same manner as before. All measurements are plotted on the same short run Xbar-R chart.
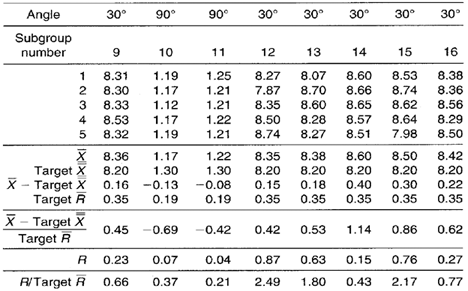
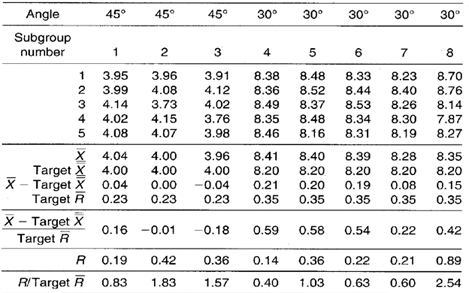
Data Collection Sheet
Table 2. Spring-back data including short run plot point calculations.
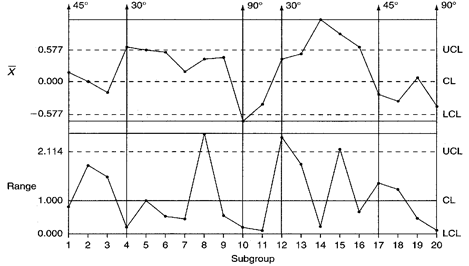
Short Run Xbar-R Chart
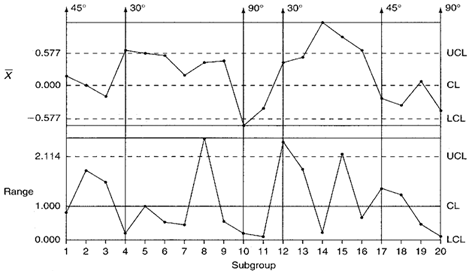
Figure 2. Spring-back short run Xbar-R control charts.
Chart Interpretation
Short run range chart: Three 30° plot points fall above the XJCL and are an indication that the variability for the 30° bends is greater than expected. The 45° plot points appear to be behaving randomly. The 90° plot points all fall below the centerline. Each pattern appears to be unique to each bend angle. There appear to be no visible patterns or trends that consistently appear across all bend angles collectively.
Short run Xbar chart: All 11 30° plot points fall above the centerline and five fall above the UCL. This indicates that the actual spring-back on 30° bends is greater than the established 8.2° target value. The 45° plot points appear to vary randomly about their target value.
The 90° plot points all fall below the centerline with one of them falling below the LCL. This indicates that the actual spring-back on 90° bends is less than the target X value of 1.3°. All plot point patterns appear unique to each bend angle. No trends are apparent across all bend angles collectively.
Recommendations
30º Bend Angles
Range plot points erratically jumping above the UCL generally indicate unstable short-term variation. This might be caused by a process change that happens to occur within a subgroup. To pinpoint the cause, a 100-percent sampling strategy with a sample size of one may need to be temporarily established.
The average spring-back is consistently greater than the established target X of 8.2°. Investigate why the spring-back rates are so much larger than the engineering target and improve the process’ ability to maintain a lesser spring-back.
45º Bend Angles
Both ranges and averages appear to behave with consistent variability. The control chart reveals no specific process control issues that need to be addressed with respect to this bend angle.
90º Bend Angles
There are only three plot points on the short run chart that represent the 90° bend angles being produced (subgroups 10, 11, and 20). However, two of the three plot points on the short run Xbar chart are very close to the LCL and one falls below. If all three subgroups were consecutive, the two-out-of-three zone analysis rule would be triggered. The user of the control chart should try to find an obvious reason for the low bend angle values. If historical 90° bend angle data revealed points that were consistently stable about the center line on the control chart, then an investigation of recent process or raw material changes might be considered.
Estimating the Process Average
Estimates of the process average should be calculated separately for each characteristic or part on short run Xbar-R charts. In this case, estimates of the process average should be calculated separately for each different spring-back angle. Calculation 1 shows the calculation for die overall average of the 30° spring-back measurements.
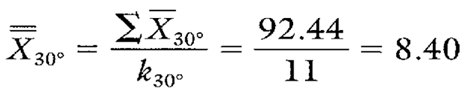
Calculation 1. Estimate of the process average for 30° spring-back angles.
Estimating Sigma
Estimates of sigma are also calculated separately for each characteristic or location represented on short run Xbar-R charts. In this case, estimates of the process standard deviation should be calculated for each different spring-back angle.
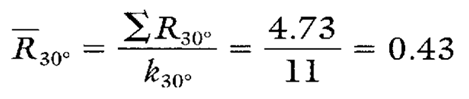
Calculation 2. Calculation of the average moving range for 30° spring back-angles (to be used in estimating the standard deviation).
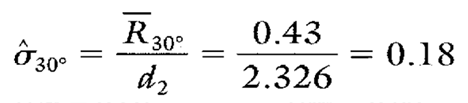
Calculation 3. Estimate of the process standard deviation for the 30° spring-back angles.
Calculating Process Capability and Performance Ratios
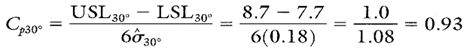
Calculation 4. Cp calculation for the 30° bend angle spring-back.
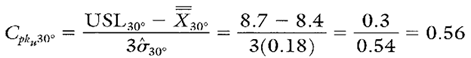
Calculation 5. Cpk upper calculation for the 30° bend angle spring-back.
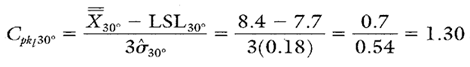
Calculation 6. Cpk lower calculation for the 30° bend angle spring-back.
Short Run Xbar-R Chart Advantages
- Graphically illustrates the variation of multiple product or process characteristics on the same chart.
- Characteristics from different parts with different means, different standard deviations, and different units of measure can be analyzed on the same chart.
- Pinpoints the characteristics that are most in need of attention.
- Separates variation due to changes in average from variation due to changes in the standard deviation.
- Separates process variation from product-specific variation.
Short Run Xbar-R Chart Disadvantages
- The use of negative numbers and unitless ratios may be confusing at first.
- X, R, and the estimate of sigma must be calculated separately for each characteristic on the chart.
- Proper chart analysis requires knowledge of how target values were derived.
Additional Comments About the Case
The process capability and performance ratio calculations for the 45° and 90° bend angle spring-back are shown in Table 17.7.
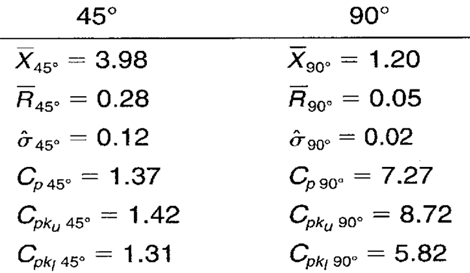
Table 3. Cp and Cpk calculations for 45° and 90° bend angle spring-back characteristics.
FOOTNOTE: 1 Wise, Stephen A. and Douglas C. Fair. Innovative Control Charting: Practical SPC Solutions for Today’s Manufacturing Environment. Milwaukee, WI: ASQ Quality Press.
Using the Target Xbar-R Chart: Example
See how a quality professional uses the target Xbar-R chart to ensure consistent process performance and meet specifications for different customers.
How Do You Use Target Xbar-R Charts?
Target Xbar and range (Xbar-R) charts can help you identify changes in the average and range of averages of a characteristic. Review the following example—an excerpt from Innovative Control Charting1—to get a sense of how a target Xbar-R chart works.
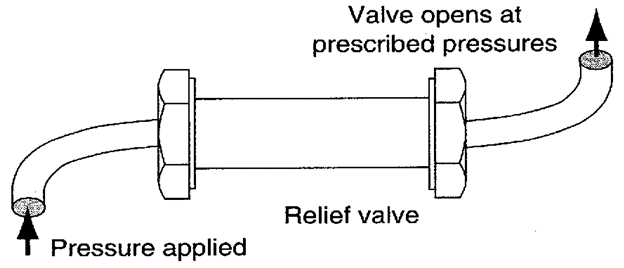
igure 1. Relief valve with adjustable cracking pressure capabilities.
Case Description
Cracking pressure, the pressure at which the relief valve opens, is a key characteristic. The valve can be adjusted during assembly to crack at different pressures. Each customer has his or her own crack pressure requirements.
In this example, the target Xbar-R chart allows quality personnel to monitor the crack-pressure testing for three customers and compare whether the process remains consistently on target when the spec requirements change.
Bring SPC Charts Up to Speed
This example provides a deep dive into the manual calculations behind the target Xbar-R chart. InfinityQS® solutions—ProFicient™ and Enact®—automate chart creation and help you optimize processes faster.
LEARN MORE ABOUT MODERN SPC SOLUTIONS
Sampling Strategy
Cracking pressure is the only characteristic, but the requirements change with each order (see Table 1). Because the production volume is steady and the standard deviation is expected to be consistent across all cracking pressure settings, a target Xbar-R chart is used to monitor the process. Valves are 100 percent tested, but for charting purposes, the test results from three out of every 30 valves are used for analysis on control charts.
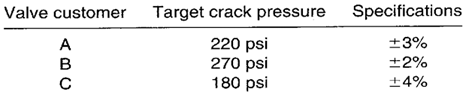
Table 1. Crack pressure requirements for three valve customers.
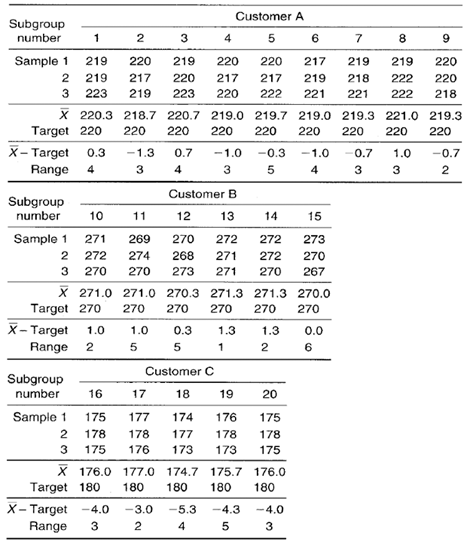
Data Collection Sheet
Table 2. Data collection sheet for relief valves.
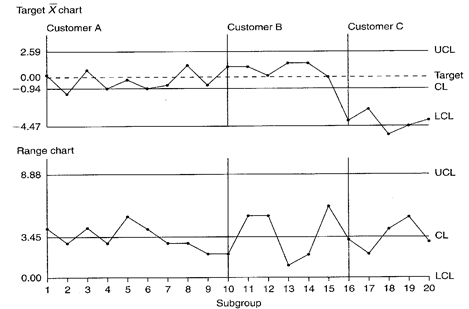
Target Xbar-R Chart
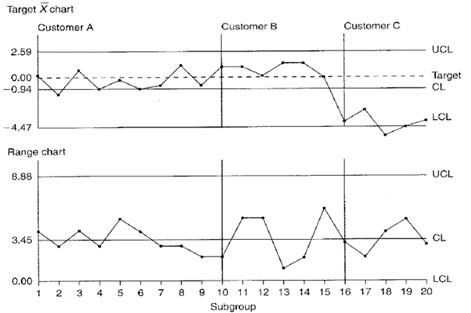
Figure 2. Crack pressure target Xbar-R control chart.
Control Limit Calculations
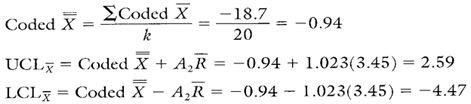
Calculation 1. Calculations for the crack pressure target Xbar chart.
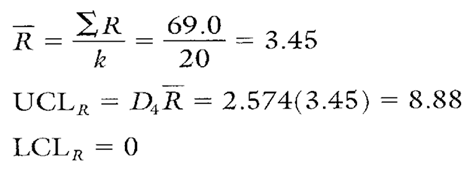
Calculation 2. Calculations for the crack pressure range chart.
Chart Interpretation
Range chart: No out-of-control plot points. There are no shifts, trends, or runs. It appears that the ranges are stable. This normal pattern supports the assumption that the process standard deviation is not affected when the valves are adjusted to different cracking pressures.
Target Xbar chart: Plot point comparisons to both the coded Xbar and the zero line must be made. Relative to the coded Xbar ( –0.94) none of the jobs is centered; this is caused mainly by customer C’s job being run well below its target of 180 psi. These plot points are pulling down the entire average, thus causing there to appear significantly long runs of plot points above the coded Xbar.
Relative to the zero line, the valve for customer A is centered on target, valves for customer B are a little on the high side of the target, and customer C’s valves are running consistently low.
Recommendations
If a characteristic is not centered on its target, either the process needs to be adjusted or the target needs to be changed.
Assuming the targets are desired values,
- Customer A valves are centered on target; no adjustment needs to be made.
- Customer B valves are a little on the high side. The benefit of centering the crack pressure on its target may not be worth the effort required if the Cp and Cpk values are high (greater than 1.3).
- Customer C valves need to be adjusted about 5 psi higher. However, before changing the process, people attending to the process should verify the off-target values are not caused by a faulty measurement system.
Estimating the Process Average
The average difference from target is not the same for all three valve adjustments. So calculations for X need to be done separately for each of the three customer requirements. The following example focuses on customer A valves.
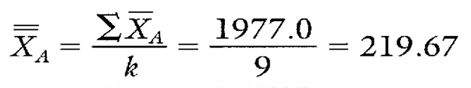
Calculation 3. Calculation for customer A’s average cracking pressure.
Estimating Sigma
Because the range chart is in control across all three customer requirements, the estimate of sigma for all valves may be based upon the range chart’s centerline (see Calculation 4). If the range chart were not in control, separate, reliable R values would need to be calculated for each of the customer requirements.
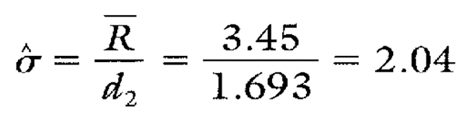
Calculation 4. Estimating sigma using R.
Calculating Process Capability and Performance Ratios
Because the R chart is in control, the same sigma may be used for separately calculating all process capability and performance ratios for the cracking pressures. Following are the Cp and Cpk calculations for customer A valves.
Calculation 5. Cp calculation for customer A valves.
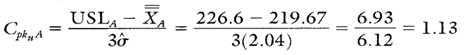
Calculation 6. Cpk upper calculation for customer A valves.
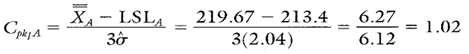
Calculation 7. Cpk lower calculation for customer A valves.
Target Xbar-R Chart Advantages
- Multiple parts, specifications, or characteristics can be plotted on the same chart (provided they all exhibit similar variability).
- Data from gauges that are zeroed out on their target values can be plotted directly on the target Xbar without further data coding or transformation.
- Statistical control can be assessed for both the process and each unique part and/or characteristic being made.
Target Xbar-R Chart Disadvantages
- Control limits are valid only when the Rs from each part on the chart are similar. When they are not similar, the suspect part(s) must be monitored on a separate chart, or the data must be collectively evaluated on a short run chart.
- When interpreting the target Xbar chart, both the zero line and the coded Xbar must be taken into account. This accounts for some added complexity when interpreting the chart.
Additional Comments About the Case
- The process capability and performance ratio calculations for the cracking pressure are shown in Table 3.
- When valves A, B, or C are run again, the new data can be combined with prior data.
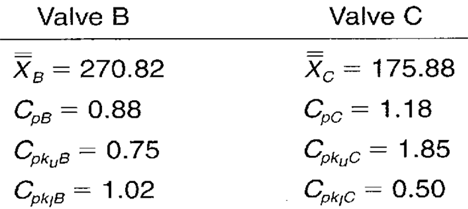
Table 3. Cp and Cpk calculations for valves B and C.
FOOTNOTE: 1 Wise, Stephen A. and Douglas C. Fair. Innovative Control Charting: Practical SPC Solutions for Today’s Manufacturing Environment. Milwaukee, WI: ASQ Quality Press.
Speak to a Manufacturing Industry Expert
What to Expect
- Free 20-minute call with a product expert
- Explore which solutions best suit your needs
- No-pressure conversation
- Get a live, personalized demo